
Top 12 Best Embedded Analytics Platforms
Choosing the wrong embedded analytics platform slows your roadmap, increases dev burden, and weakens the product experience. Many tools check feature boxes but fail on pricing models, embedding control, integration fit, and long-term scale.
Executive Summary:
To help you make an informed choice, we analyzed and compared the 12 best embedded analytics platforms side by side, focusing on the features that matter most for ISVs and SaaS companies.
Features compared:
- Embedding Method
- Self-Service Dashboards
- Deployment Flexibility
- AI Features
- White Label Capabilities
- Pricing Model
- Data Source Compatibility
| Platform | Embedding Method | White Label Capabilities | Self-Service Dashboards | Pricing Model | Deployment Flexibility | Data Source Compatibility | AI Features |
|---|---|---|---|---|---|---|---|
| Reveal | SDK | Full | Yes | Fixed | Cloud, On-prem | Broad | Predictive, ML, NLP, AI Insights |
| Sisense | SDK (iFrame-wrapped) | Moderate (iFrame-limited) | Yes | Opaque | Cloud, On-prem | Broad | AI-driven insights |
| Qlik | SDK, iFrame | Partial | Partial | Tiered | Cloud, On-prem | Broad | AI-powered automation |
| Looker | iFrame, API | Partial | Yes | Tiered | Cloud, On-prem | Broad | Integrated via BigQuery ML |
| Tableau | iFrame, API | Partial | Yes | Usage-based | Cloud, On-prem | Broad | AI via Tableau Pulse |
| Power BI | iFrame, API | Partial | Yes | Usage-based | Cloud (Azure only) | Broad | Azure ML integrations |
| ThoughtSpot | SDK, iFrame | Full | Yes | Tiered | Cloud, On-prem | Broad | Natural language search |
| Luzmo | SDK | Full | Yes | Tiered | Cloud | Broad | Predictive analytics |
| GoodData | SDK | Extensive | Yes | Tiered | Cloud, On-prem | Broad | AI-assisted insights |
| Embeddable | SDK | Full | Yes | Fixed | Cloud | Moderate | Limited |
| Domo | iFrame | Partial | Yes | Opaque | Cloud | Broad | AI & ML engine |
| Qrvey | SDK | Full | Yes | Fixed | Cloud (AWS only) | Broad | Generative AI, Automation |
Reveal
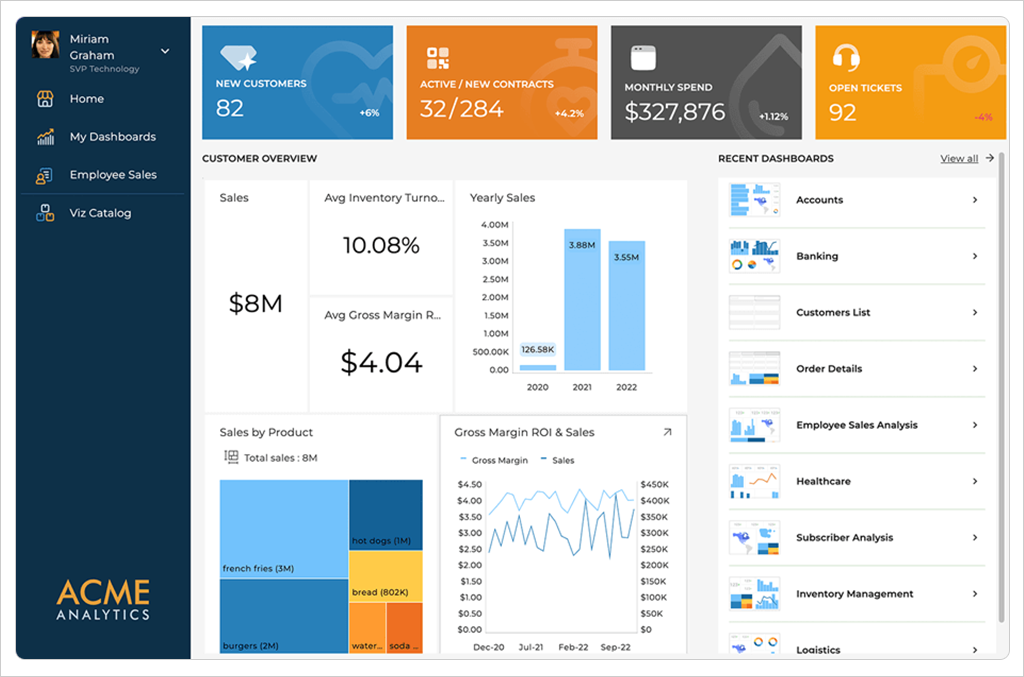
Reveal is built specifically for embedded analytics. It’s not a repurposed BI tool. With an SDK-first approach, it gives teams full control to integrate analytics directly into their product without the limitations of iFrames, external tools, or unpredictable pricing.
Embedding Method
With a native SDK instead of iFrames, you get full control over how analytics are rendered and interacted with. This makes it the ideal embedded analytics solution for companies offering customer-facing analytics. Reveal integrates directly into your app’s logic, supporting context-aware filtering, event handling, and authentication.
White Label Capabilities
Full white label analytics support lets you fully match dashboards, themes, and layouts to your UI. No Reveal branding or external redirects—everything stays in your app.
Self-Service Dashboards
Built-in drag-and-drop dashboard creation lets end users build and manage their own dashboards without developer involvement. This reduces support requests and drives higher adoption.
Pricing Model
Fixed, per-application pricing with no user or usage-based tiers. Costs stay predictable as your customer base grows.
Deployment Flexibility
Deploy in your own environment—cloud, server, or premises. No vendor-controlled backend is required.
Data Source Compatibility
Reveal ensures a broad data source compatibility. The platform seamlessly connects to SQL Server, PostgreSQL, MySQL, Oracle, Azure, REST APIs, JSON, and CSV. Works with your existing data stack with no proprietary lock-in.
AI Features
Includes core AI features like trend forecasting, time series predictions, and ML visualizations. Reveal also supports NLP for conversational analytics and AI-driven drill downs, reducing errors and delivering reliable insights.
Summary
Reveal offers full-stack control from UI to deployment, with predictable pricing and an SDK built for developers. It is a strong fit for SaaS and ISV teams that need embedded analytics to feel like a native feature, not a third-party experience.
Sisense
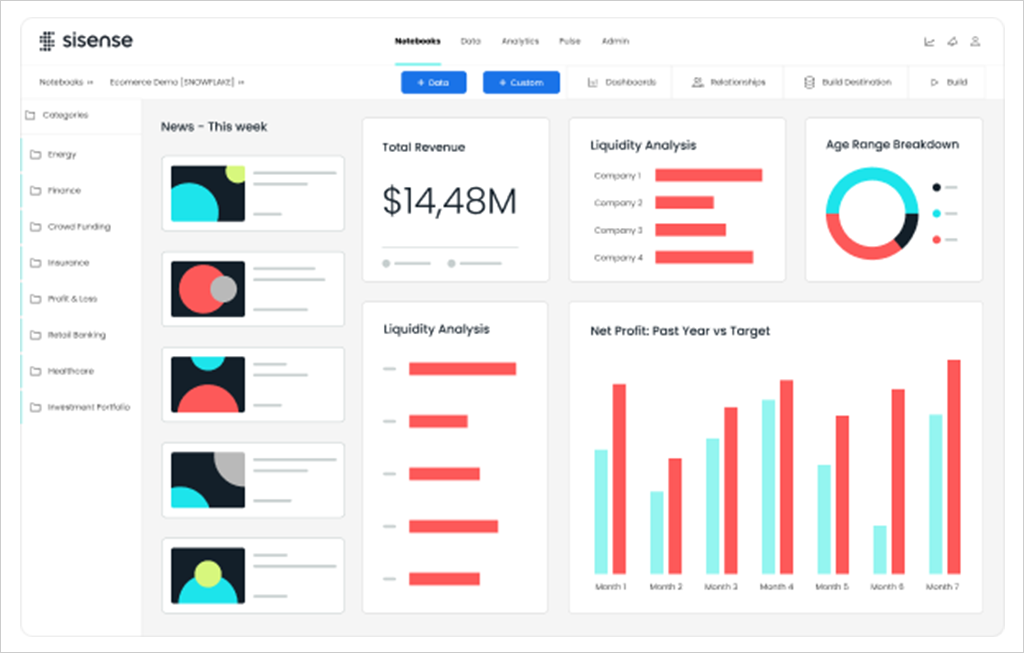
Sisense markets itself as a flexible, developer-friendly platform. While technically capable, its architecture introduces integration and customization challenges that product teams should carefully weigh.
Embedding Method
Although it offers a Compose SDK, the platform wraps analytics in iFrames. This limits layout control, degrades UI consistency, and complicates contextual interactivity. For teams prioritizing seamless UX, this is a structural limitation.
White Label Capabilities
Supports theming and branding removal, but embedding constraints restrict full visual alignment. Deep UI customization requires workarounds and may not match native component behavior.
Self-Service Dashboards
Provides robust drag-and-drop dashboard creation. However, the platform’s complexity often requires user onboarding and technical training to unlock full value.
Pricing Model
Pricing is not publicly disclosed and varies based on user type, workload, and deployment. This makes cost forecasting difficult for teams planning to scale.
Deployment Flexibility
Supports cloud, hybrid, and on-prem deployment. You can self-host or use Sisense-managed infrastructure, depending on security or architecture needs.
Data Source Compatibility
Broad compatibility with SQL and NoSQL sources, cloud data warehouses, and REST APIs. Supports both live and cached data models.
AI Features
Offers AI-assisted forecasting, NLQ, and automated prep. However, these features are selectively available and not fully integrated across the platform.
Summary
Sisense delivers strong functionality, but iframe-based embedding, limited white label flexibility, and opaque pricing create friction for SaaS and ISV product teams seeking tightly integrated, scalable analytics.
Qlik
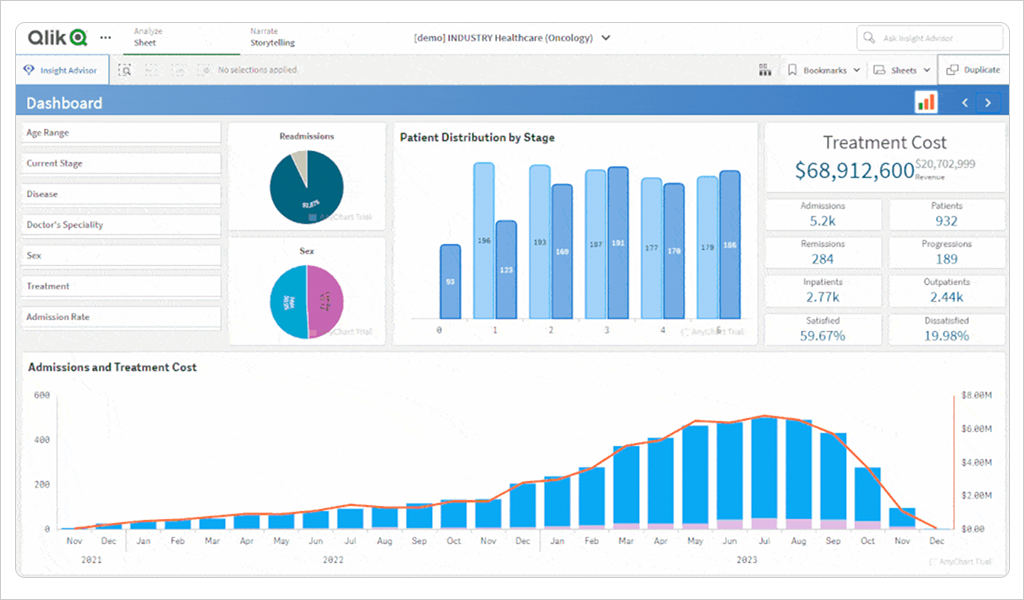
Qlik is built around an associative data engine and strong internal BI workflows. However, it wasn’t designed for embedded use. This limitation becomes apparent when deployed in customer-facing products.
Embedding Method
Relies on a mix of iFrames, JavaScript mashups, and APIs. While developer tools exist, embedding is fragile. Deep integration requires stitching together components, which increases maintenance and reduces stability.
White Label Capabilities
Limited customization. Basic theming is available, but full rebranding is not. UI control is constrained, and embedded content often feels externally sourced rather than truly native.
Self-Service Dashboards
Available, but not intuitive. Dashboard creation requires knowledge of Qlik Sense structure and logic. This raises the technical barrier for end users and adds support overhead.
Pricing Model
Tiered and role-based pricing. Costs vary by user role and SKU, making it difficult to forecast total spend without direct vendor negotiation.
Deployment Flexibility
Supports Qlik Cloud and Qlik Sense Enterprise for private deployments. However, differences in feature parity and embedding support across editions add complexity to architectural planning.
Data Source Compatibility
Strong data compatibility. Supports cloud, on-premises, real-time sources, and complex data models. Qlik’s data engine remains a key strength.
AI Features
Includes AI-driven insights, anomaly detection, and forecasting. While effective for internal BI, these tools require additional setup to perform well in embedded use cases.
Summary
Qlik is strong for enterprise BI but not built for embedded use. Integration is rigid, white labeling is limited, and pricing is complex. Best suited for internal dashboards, not SaaS products that require native, scalable analytics.
Looker
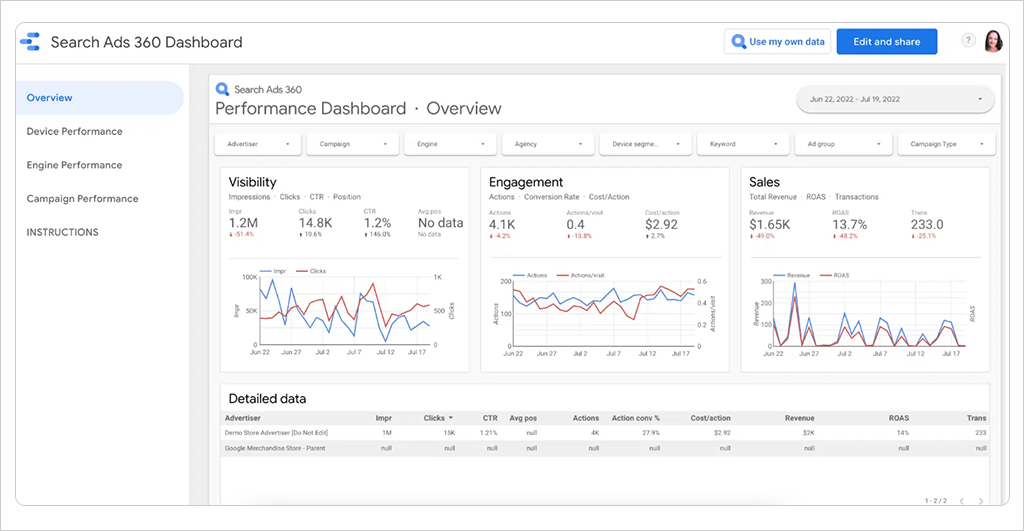
Known for strong metric governance and semantic modeling, Looker was not designed for embedded use. Product teams can expect friction when integrating it into external applications.
Embedding Method
Supports iFrame and API-based embedding. There is no SDK. Layout and interactivity are limited by external rendering. Expect workarounds to maintain UX consistency.
White Label Capabilities
Partial customization. Themes can be applied and basic branding removed, but the core UI remains recognizable. Deep visual integration is not supported.
Self-Service Dashboards
Tied to LookML. Users can explore data, but dashboard creation depends on pre-modeled views and often requires developer support. Self-service is limited rather than fully autonomous.
Pricing Model
Quote-based and opaque. Pricing varies by usage, user type, and compute, with no public tiers. Teams must engage in vendor negotiations to estimate costs.
Deployment Flexibility
Only supported on Google Cloud, either hosted or self-managed. No deployment on AWS, Azure, or on-prem. These limits fit for hybrid or non-GCP environments.
Data Source Compatibility
Strong with SQL-based warehouses but requires data to be modeled in LookML. This slows onboarding for teams with agile or evolving schemas.
AI Features
Connects to BigQuery ML for predictive workflows but lacks native AI tools inside dashboards. Any advanced modeling must be done outside the platform.
Summary
Looker delivers strong governance and modeling, but is not built for embedded analytics. Limited white labeling, rigid deployment, and high total cost of ownership make it a poor fit for teams that need fast, native integration outside of Google Cloud.
Tableau
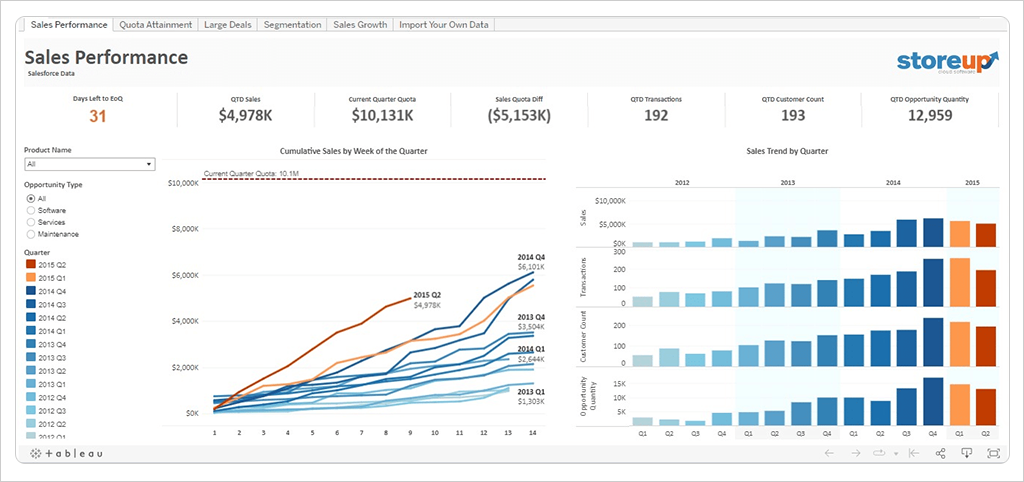
Tableau is a dominant BI platform, but embedding it introduces structural friction. It was designed for internal dashboards, not product-native analytics.
Embedding Method
Relies on iFrames and JavaScript APIs. Embedding requires a connection to Tableau Server or Cloud. There’s no SDK. Integration is shallow and constrained by external hosting.
White Label Capabilities
Limited customization. Some theming is available, but full white labeling is not. Tableau’s UI, controls, and branding remain visible, and dashboards consistently look like Tableau.
Self-Service Dashboards
Users can build dashboards, but they need to be inside the Tableau interface. There’s no in-app editor or native builder. This breaks embedded UX and requires users to learn a separate tool.
Pricing Model
Role-based pricing is structured around Viewer, Explorer, and Creator tiers, with separate charges for hosting. As usage grows, costs scale quickly. Forecasting total spend is difficult without ongoing monitoring.
Deployment Flexibility
Supports both SaaS via Tableau Cloud and self-managed deployments with Tableau Server. However, embedded dashboards rely entirely on Tableau infrastructure, adding overhead in authentication, maintenance, and version control.
Data Source Compatibility
Broad support for databases, data warehouses, and flat files. Performs well in hybrid environments when infrastructure is properly tuned, though query performance can vary based on data preparation and modeling.
AI Features
Includes Explain Data and forecasting tools. Einstein Discovery adds advanced AI capabilities, but the experience is geared toward analysts rather than front-end users or product workflows.
Summary
Tableau excels in internal BI but falls short for embedded use. Its iFrame approach, limited UI control, and usage-based pricing make it a poor fit for teams building seamless, in-product analytics experiences.
Power BI Embedded
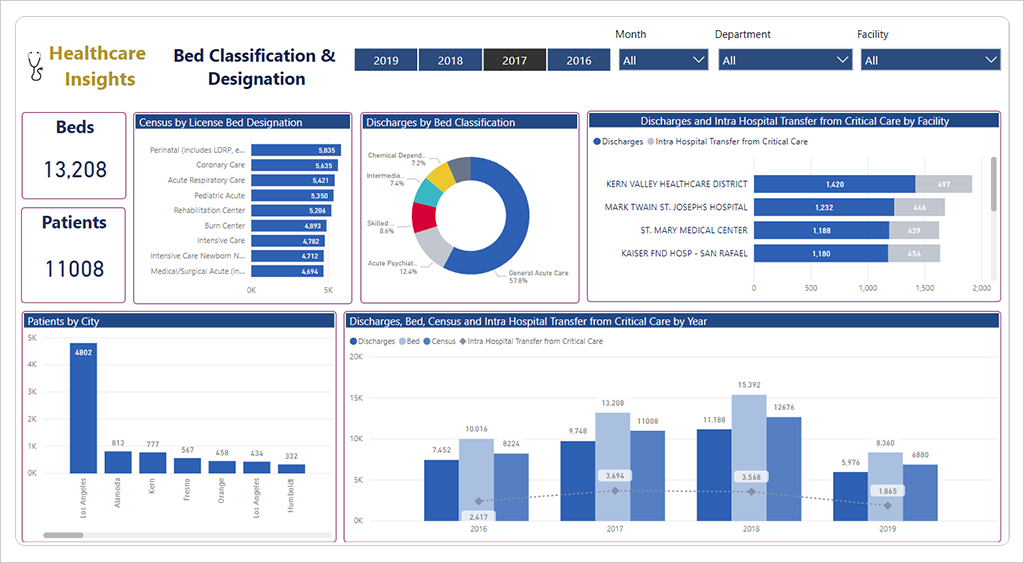
Power BI Embedded is Microsoft’s solution for external analytics integration. It offers strong visualizations and tight Azure alignment, but with tradeoffs in flexibility and developer control.
Embedding Method
Relies on iFrames and JavaScript APIs with no native SDK. All content is delivered through Power BI’s cloud infrastructure, limiting control over layout, behavior, and integration depth.
White Label Capabilities
Partial customization. Custom themes and branding removal are supported, but the UI remains tied to Microsoft’s design conventions. Full white labeling is not achievable.
Self-Service Dashboards
Available, but not natively embedded. Users create and manage dashboards in the Power BI environment, not inside your application. Enabling in-app self-service requires complex licensing, workspace setup, and Azure configuration.
Pricing Model
Usage-based pricing tied to capacity, with A SKUs for development and P SKUs for production. Costs scale with compute rather than user count, making usage spikes a source of unpredictable charges.
Deployment Flexibility
Azure only. There is no support for AWS, GCP, or hybrid deployments. Embedding Power BI ties your analytics architecture to the Microsoft cloud ecosystem.
Data Source Compatibility
Excellent for Microsoft-native sources (SQL Server, Excel, Azure Synapse). Supports external sources, but integration is less seamless and may require additional ETL.
AI Features
Well-developed feature set with NLP, predictive modeling, and machine learning visualizations. However, many capabilities require add-ons, Azure ML services, or premium licensing.
Summary
Power BI Embedded delivers enterprise-grade visuals but sacrifices flexibility. Azure lock-in, compute-based pricing, and limited white labeling make it better suited for Microsoft first teams than for independent product builders.
ThoughtSpot
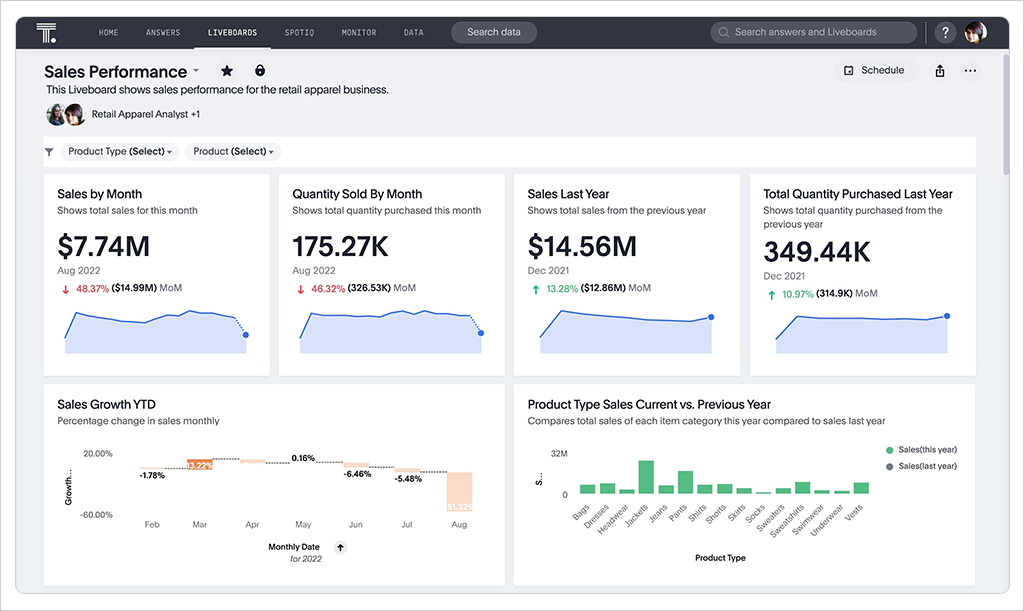
ThoughtSpot emphasizes natural language exploration over traditional dashboarding. While its AI and search-first model is powerful for internal users, embedded use comes with structural limitations.
Embedding Method
Uses a JavaScript-based Visual Embed SDK, focused on embedding individual components like search bars or charts rather than full dashboard experiences. Deep integration is limited to predefined embed types.
White Label Capabilities
Supports branding, theming, and layout alignment, but embedded content retains elements of the ThoughtSpot interface. UI control is limited to what the SDK exposes.
Self-Service Dashboards
Search is the primary user experience. Users ask questions in natural language to generate visuals. While dashboard creation is supported, it is not the core focus. The interface can be unintuitive for non-technical users unfamiliar with schema-aware queries.
Pricing Model
Tiered and opaque pricing. Costs vary by role, usage, and deployment, with no public tiers. Forecasting spend at scale requires direct vendor negotiation.
Deployment Flexibility
Flexible deployment options include SaaS, cloud-hosted, and on-premises. Supports AWS, Azure, and Kubernetes environments, making it a strong fit for teams with regulatory or hosting requirements.
Data Source Compatibility
Supports major data warehouses like Snowflake, BigQuery, and Redshift, along with other SQL-based sources. Live query models are available, though complex data modeling requires setup through ThoughtSpot’s data layer.
AI Features
Robust AI capabilities. SpotIQ and Search Assist provide natural language querying, pattern detection, and automated insights. These features are deeply integrated and represent a core strength of the platform.
Summary
ThoughtSpot delivers strong AI-powered search but lacks the UI control and embedding depth needed for fully customized, product native experiences. Best suited for products focused on exploratory analytics, not for use cases that require tight design alignment or full dashboard control.
Luzmo
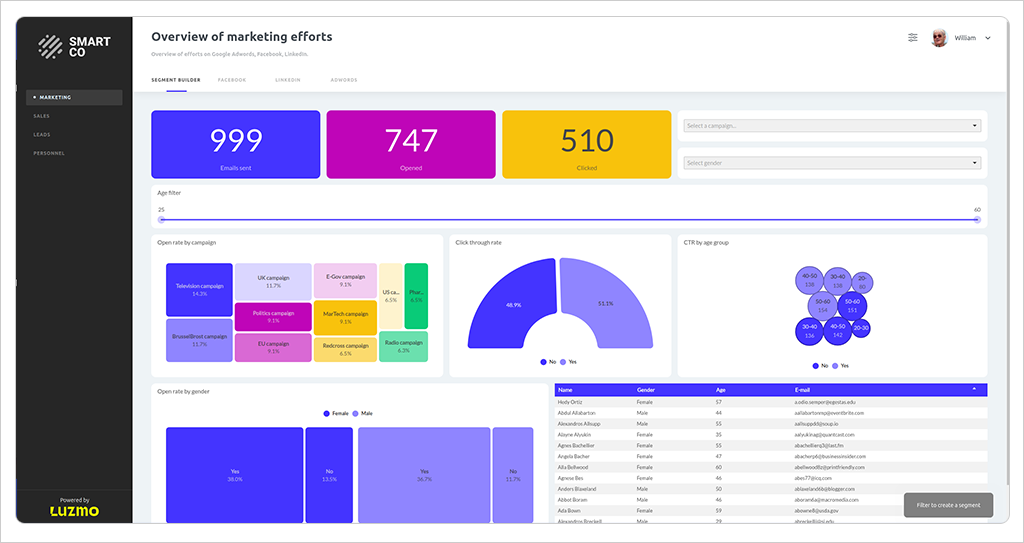
Luzmo targets fast-moving SaaS teams with lightweight embedded analytics. It is optimized for speed and ease of use but comes with tradeoffs in scale, flexibility, and enterprise readiness.
Embedding Method
JavaScript SDK-based embedding. Dashboards and components can be embedded directly without iFrames. Developers control placement and interaction, but functionality is limited to what the SDK exposes.
White Label Capabilities
Strong customization. Full control over styling, including fonts, layout, and colors. Embedded Luzmo dashboards can align fully with the host UI and display no visible branding.
Self-Service Dashboards
Supported via an intuitive builder. End users can build and edit dashboards easily, but feature depth is limited. Advanced interactions, multi-source joins, and parameterized filtering require workarounds or backend prep.
Pricing Model
Tiered pricing based on seat type, feature access, and usage volume. Costs scale quickly as viewer and editor counts grow, making it harder to control spend at higher adoption levels.
Deployment Flexibility
Cloud only. All analytics are hosted on Luzmo infrastructure with no support for on-premises, private cloud, or customer-managed environments. This limits suitability for regulated or enterprise deployments.
Data Source Compatibility
Moderate data connectivity. Supports REST APIs, PostgreSQL, MySQL, and flat files. Native connectors for enterprise data stacks are limited, and additional setup may be needed for legacy or complex systems.
AI Features
Minimal AI capabilities. Offers basic forecasting and trend detection but lacks native support for machine learning pipelines, predictive modeling, or integrated NLP. AI is not a core focus.
Summary
Luzmo is well-suited for early-stage products that need a quick, polished dashboard embedding with minimal development effort. It is less suitable for use cases that require advanced analytics, on-premises control, or deep enterprise data integration.
GoodData
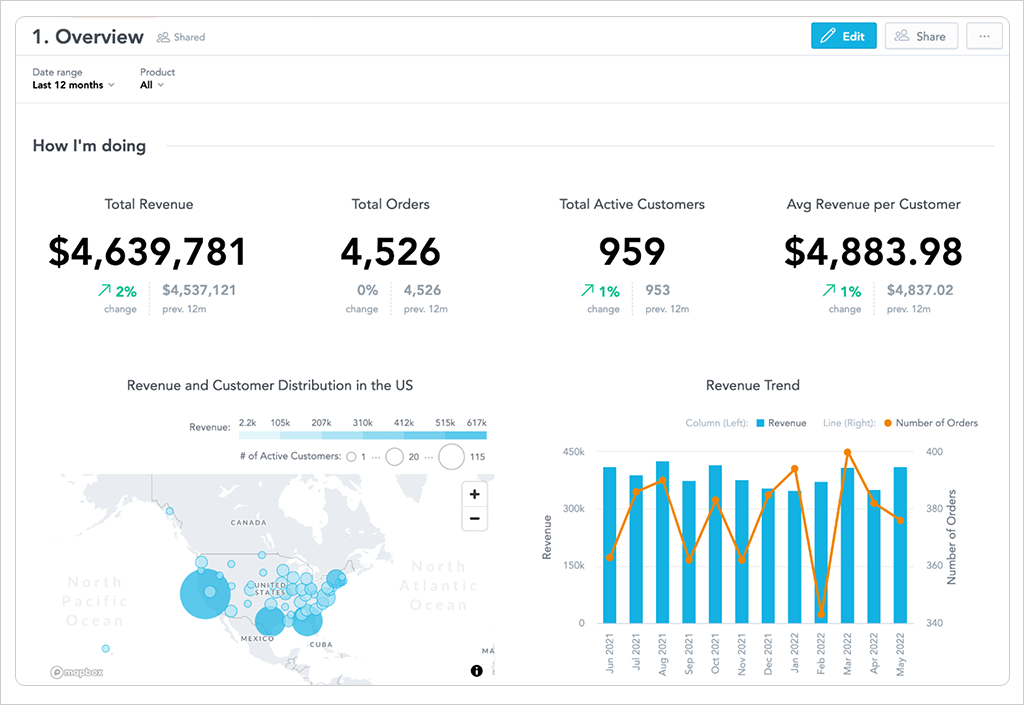
GoodData has evolved from a managed BI platform to an API-first embedded analytics platform. It offers strong governance and flexible deployment options, but leans heavily on the enterprise in both setup and UX.
Embedding Method
SDK-based embedding with a modern React SDK and REST APIs. Developers can embed dashboards or individual components with full control over layout and interaction. Native integration is smooth for those working in React.
White Label Capabilities
Extensive customization. Full control over theming, layout, and branding. The SDK enables alignment with your product’s UI without any visible vendor elements.
Self-Service Dashboards
Available via Analytical Designer. Feature-rich but designed for analysts. Less intuitive for non-technical users. Requires onboarding and training to drive adoption at scale.
Pricing Model
Custom tiered pricing with no public transparency. Costs vary based on deployment model, feature set, and usage. Forecasting the total cost of ownership requires direct vendor engagement.
Deployment Flexibility
Broad deployment support across SaaS, customer cloud environments (AWS, Azure, GCP), and full on-premises. Provides granular control over architecture and data residency, aligning well with enterprise security requirements.
Data Source Compatibility
Wide data compatibility with cloud warehouses, SQL sources, and REST APIs. Uses a semantic data model to define shared KPIs, which improves consistency but introduces additional setup overhead.
AI Features
Minimal AI capabilities. Not a core differentiator. Predictive use cases require external machine learning tools or custom integrations.
Summary
GoodData is well suited for enterprise SaaS products that require governed, multi-tenant analytics with full stack control. For lighter-weight applications or faster deployment cycles, the complexity may outweigh the benefits.
Embeddable
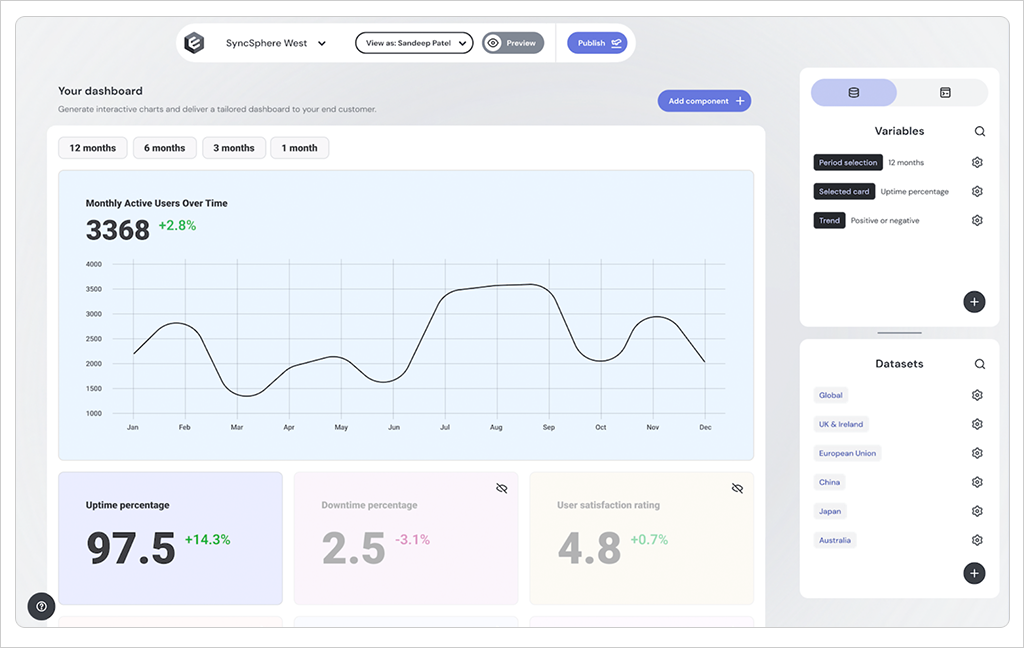
Embeddable targets product teams prioritizing fast integration and minimal overhead. It’s lightweight, developer-friendly, and built for quick deployment. However, these benefits come at the cost of advanced features and enterprise flexibility.
Embedding Method
SDK-based embedding with a clean JavaScript SDK that enables native integration without iFrames, allowing dashboards to drop directly into your UI and be managed using familiar web development patterns.
White Label Capabilities
Full customization support. Branding can be fully matched, all vendor elements removed, and visuals tightly aligned with your product for strong UX consistency in customer-facing applications.
Self-Service Dashboards
Users can edit and filter dashboards, but only within a limited builder. The focus is on data consumption, not full dashboard design. Suitable for end users, not analysts.
Pricing Model
Fixed pricing model. Per-seat costs are tied to environment size, with no usage-based charges. This simplifies forecasting and is designed for mid-market and early-stage products.
Deployment Flexibility
All cloud-based. Dashboards are hosted by Embeddable with no support for on-premises or private cloud environments. This may be a blocker for regulated industries or enterprise buyers.
Data Source Compatibility
Moderate data connectivity. Supports standard SQL databases, REST APIs, and file-based sources. Well-suited for typical SaaS stacks, though more complex pipelines may require workarounds.
AI Features
Minimal AI capabilities. No native support for predictive modeling, natural language queries, or AI-powered analytics. These are not a focus of the platform.
Summary
Embeddable is a fast, affordable option for SaaS products that need native dashboards without added infrastructure complexity. A strong fit for straightforward use cases, but less suitable for enterprise needs involving complex data or compliance requirements.
Domo
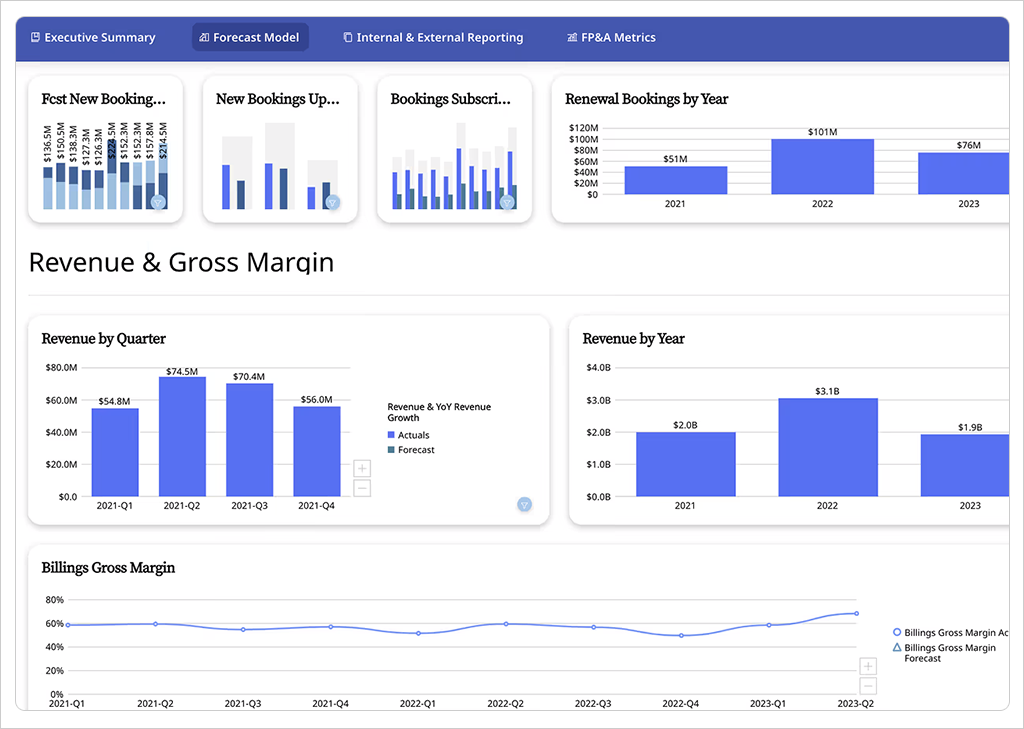
Domo is a full-stack analytics platform with integrated ETL, warehousing, and dashboard tools. It’s powerful for internal BI but rigid for embedded use, with limited control and vendor lock-in concerns.
Embedding Method
iFrame-based embedding. Dashboards are rendered through iFrames with minimal JavaScript customization and no SDK. While content can be displayed, interaction, theming, and layout remain constrained.
White Label Capabilities
Partial customization. Branding and color schemes can be adjusted, but the interface remains distinctly Domo. Full UI integration with your product is not achievable.
Self-Service Dashboards
Supported through a strong internal builder, but embedded use cases require additional licensing and setup. Dashboards remain inside Domo’s interface, not your own.
Pricing Model
Opaque and tiered. Pricing varies based on user count, feature access, and usage volume. Cost increases at renewal are common, making it difficult to forecast at scale.
Deployment Flexibility
Domo is a cloud-only platform hosted on its own infrastructure. It does not support private cloud or on-premises deployment, which limits options for compliance-sensitive use cases.
Data Source Compatibility
Strong connectivity with prebuilt connectors to cloud apps, databases, and APIs. Includes a proprietary ETL and data modeling layer. Flexibility comes at the cost of added complexity.
AI Features
Basic AI functionality. Domo.AI offers automated insights and alerts, but the capabilities are at an early stage and not deeply integrated into embedded workflows.
Summary
Domo is best suited for internal BI within its own ecosystem. Embedded use cases face limits in customization, pricing transparency, and deployment control. Not ideal for those prioritizing UX, governance, or platform independence.
Qrvey

Qrvey is purpose-built for embedded analytics in AWS environments. It provides full stack capabilities, deep customization, and fixed pricing—provided you are fully committed to AWS.
Embedding Method
SDK-based integration with a modern JavaScript SDK and APIs. Embeds natively without iFrames, supporting event hooks, dynamic rendering, and secure in-app analytics.
White Label Capabilities
Full customization. Dashboards can be fully aligned with your UI, including branding, layout, and theming, with no visible Qrvey footprint.
Self-Service Dashboards
Supported natively. End users can build, edit, and manage dashboards within your product using intuitive tools. Designed specifically for customer-facing self-service.
Pricing Model
Fixed pricing model. As of 2025, Qrvey does not use usage-based tiers, making budgeting predictable even as usage grows.
Deployment Flexibility
AWS only. Qrvey runs entirely within your AWS environment, giving you full control over data, performance, and compliance. Does not support Azure, GCP, or on-premises deployment.
Data Source Compatibility
Broad data compatibility. Supports common databases, APIs, and SaaS platforms. All data remains within your AWS instance, supporting strict governance and residency requirements.
AI Features
Solid AI features include natural language querying, AI-driven visualizations, and automation workflows. Useful for embedded scenarios, though not enterprise-grade.
Summary
Qrvey is a strong choice for SaaS products running on AWS that require native embedding, white labeling, and cost control. For those on other cloud providers or needing multi-cloud support, it is not the right fit.
How to Choose the Right Embedded Analytics Solution
Choosing an embedded analytics platform is less about checking off features and more about long-term fit. When analytics are embedded into your product, the solution must scale with your architecture, align with your UX, and avoid punishing growth through added fees. Here’s what matters:
1. Embedding Method: SDK vs. iFrame
iFrame-based tools limit control, create visual disconnects, and constrain interaction patterns. A native SDK gives you full control over layout, behavior, and how analytics respond to your app’s context.
What to look for:
- SDKs for JavaScript, .NET, or your target frameworks
- Event hooks and context-aware filters
- No external viewers or iFrame wrappers
2. Developer Experience and Time to Integration
Lengthy onboarding and unfamiliar APIs delay delivery. The strongest platforms integrate cleanly into your existing tech stack, with clear documentation and native implementation paths.
What to look for:
- Clean, modular SDKs
- Code samples and sandbox environments
- No mandatory use of a vendor backend or proprietary query language
3. Customization and White-Label Control
Analytics should look and feel like your product, not like a separate tool. UI control is critical for brand
consistency and user trust.
What to look for:
- Full theming support: colors, fonts, layout
- Ability to remove vendor branding
- Responsive design that matches your UI patterns
4. Self-Service Analytics for End Users
Developer bottlenecks happen when users can’t create or modify dashboards on their own. The right platform gives users power without introducing complexity.
What to look for:
- Drag-and-drop dashboard creation
- In-app editing without developer intervention
- Role-based control over what users can see or do
5. Predictable, Scalable Pricing
Usage-based pricing, whether by user, session, or compute, makes costs unpredictable as adoption grows. This introduces long-term risk to budgeting and planning.
What to look for:
- Transparent pricing structures
- Fixed or per-app pricing options
- No hidden fees tied to usage or scale
6. Deployment Flexibility
Some platforms restrict deployment to their own cloud environment, limiting compliance options, data control, and architectural alignment.
What to look for:
- Support for cloud, on-prem, and hybrid
- Ability to deploy within your infrastructure
- No vendor lock-in on backend services
7. Data Source Compatibility
Analytics must work with the systems you already use without requiring a new pipeline or stack.
What to look for:
- Native connectors for SQL, REST APIs, and flat files
- Support for real-time and batch processing
- No forced transformation through vendor data models
8. AI Features That Matter
Many platforms promote AI, but few make it practical. You need tools that generate value, not just buzzwords.
What to look for:
- Forecasting and trend analysis
- Natural language queries that work inside your app
- Smart visuals and assisted exploration that support real use cases
The right embedded analytics platform offers control, reduces engineering overhead, and functions as a strategic asset. It should not become another system to maintain. Prioritize native integration, UX flexibility, self-service tooling, and pricing that supports growth rather than penalizing it.
When these factors are weighed carefully, the right choice becomes clear. It is not the platform with the most features, but the one that fits your product.
What to Remember
There are numerous analytics platforms available on the market. Most weren’t built to be embedded. They were built for analysts and then retooled for apps. That distinction matters.
If the goal is to bolt dashboards onto your product, many tools will suffice. But embedding analytics into the core experience, where it must look, feel, and perform like your application, significantly narrows the field.
Here’s what matters most:
- SDK over iFrame: You need full control, not a framed report inside your UI.
- Fixed Pricing: Predictable costs beat usage-based tiers. You cannot scale a product on unstable
margins. - Full White Labeling: Analytics must match your product end-to-end. Anything less feels bolted
on. - Built-in Self-Service: End users should explore and create without handoffs or dev cycles.
- AI That Works: Automation should reduce support and development time, not just check a box.
Reveal was built to solve all of this.
SDK built for developers. Fully customizable. Fixed pricing. Fast to deploy.
It doesn’t require you to change your product. It fits into what you’ve already built.


