
Tableau Embedded Analytics: Pros, Cons, & Alternatives
Tableau Embedded is often used to extend internal dashboards into external apps, but its architecture poses challenges for customer-facing products. iFrames limit UI control, pricing scales with usage, and customization is constrained. As expectations shift, many CTOs and SaaS leaders are prioritizing embed-first platforms with developer control, white label flexibility, and built-in AI for product environments.
Executive Summary:
As product leaders push to deliver differentiated, insight-driven experiences, the goal is clear: offer seamless in-app analytics that drive value, reduce churn, and align with user workflows.
For many, Tableau is the default starting point—widely recognized and already used internally. However, recognition does not equal readiness. The question is not whether Tableau can be embedded, but whether Tableau Embedded Analytics meets modern product demands like integration flexibility, cost predictability, and full UX control.
Before committing, it is essential to assess how well its architecture aligns with the needs of your application.
Is Tableau Embedded Built for Your Product Architecture?
While Tableau excels in traditional BI scenarios, its embedded capabilities were introduced later, not built into the foundation. That distinction matters when analytics are part of your product experience, not just a reporting layer.
The architecture behind Tableau Embedded relies on iFrames and limited APIs, restricting deep integration, customization, and control over user experience—issues that quickly surface in customer-facing SaaS environments.
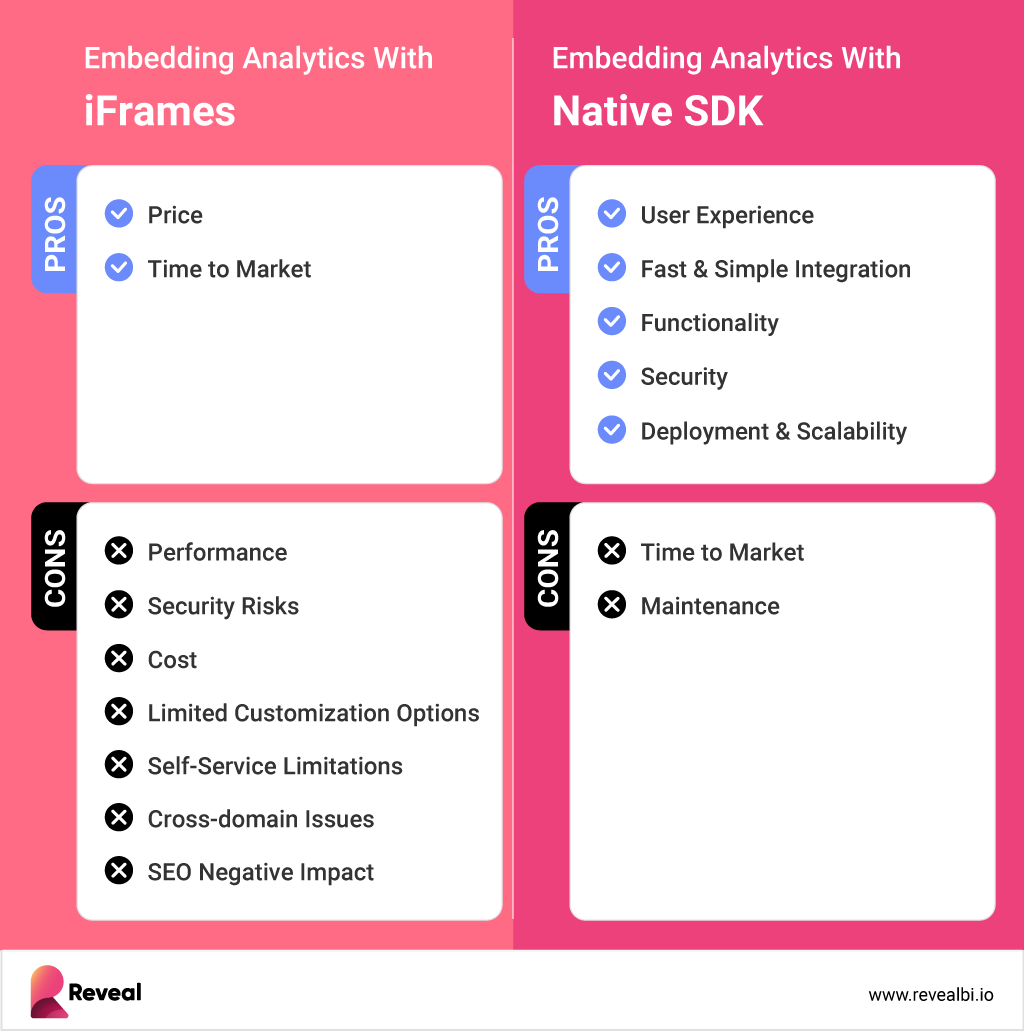
Architectural choices made today define your ability to scale, maintain flexibility, and deliver analytics that align with your brand and performance expectations. Repurposing tools originally designed for internal reporting often introduces technical limitations.
These constraints can hinder innovation and make cost management more difficult as usage grows. What works for back-office reporting rarely delivers the control, customization, and user experience required in customer-facing applications.
If you’re embedding analytics into a customer-facing product, it’s not enough to ask whether Tableau can be embedded. The real question is whether it can meet your product’s demands for performance, customization, and long-term scalability. With that lens, let’s break down where Tableau Embedded adds value—and where it starts to create friction for modern SaaS teams.
Pros: What Tableau Embedded Analytics Does Well
Tableau Embedded allows product teams to extend their existing dashboards into applications with minimal setup. It’s a practical option when visual polish, enterprise authentication, and reuse of internal Tableau assets are the top priorities.
For organizations already invested in the Tableau ecosystem, this approach can offer a fast path to delivering analytics, particularly in partner-facing tools or internal portals.
Here’s where Tableau Embedded performs well:
- Highly Intuitive, interactive visualizations: Tableau’s core strength is its visualization engine. Dashboards are interactive, polished, and work well for presenting static KPIs. But in embedded use cases, these visuals are locked into Tableau’s layout constraints with limited control over responsiveness or native behavior.
- Simple Embedding Options: Teams can choose between quick-start iFrame integration or the JavaScript API for slightly more control over placement and interactions.
- Robust Data Connectivity: Tableau connects to a broad set of data sources like databases, CRMs, and cloud tools, which helps unify reporting. But for embedded dashboards, performance depends heavily on pre-aggregated data and careful query optimization. Real-time exploration at scale often requires extra tuning.
Huge Community and supporting system: Tableau has a large community with plenty of tutorials and workaround threads. This is valuable when internal documentation falls short. That said, most guidance is geared toward internal BI use, so companies seeking to embed their analytics may need to fill some key gaps on their own. For internal BI extensions or lightweight analytics in apps where branding and UX integration aren’t mission-critical, Tableau Embedded can provide value without requiring a new analytics platform.
Cons: Key Challenges with Tableau Embedded Analytics
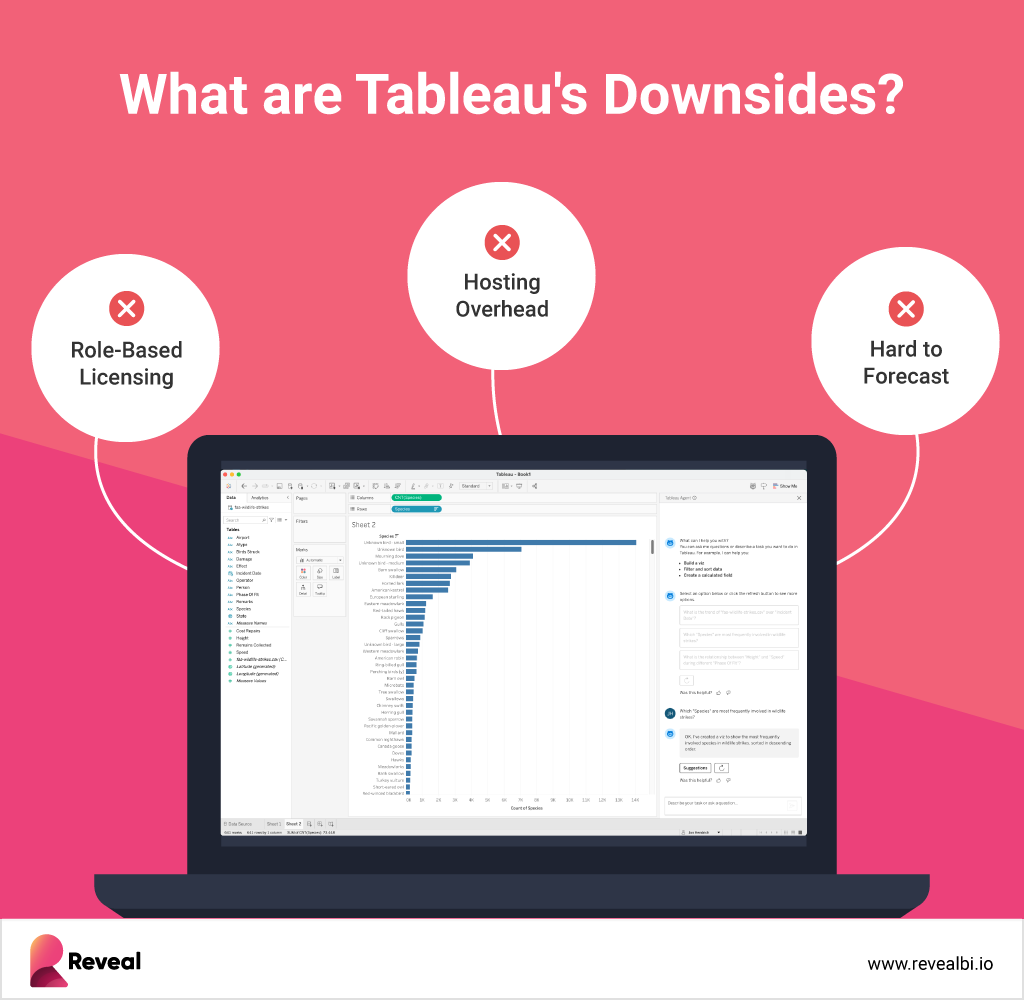
While Tableau Embedded offers quick wins for visualizing data, product teams often encounter roadblocks when integrating it into customer-facing applications. These limitations stem from its core architecture, which prioritizes analyst workflows over modern embedding needs.
Here are the most common friction points:
- Unpredictable Pricing as You Scale: Tableau’s usage-based model ties costs to user count and infrastructure. This makes it hard to forecast spend—especially in fast-growing SaaS environments where user engagement is dynamic.
- iFrame-Based Integration Limits UX: Embedding Tableau via iFrames restricts your control over styling, responsiveness, and layout. As a result, dashboards can feel disconnected from your application and dilute the user experience.
- Minimal Developer Flexibility: Tableau offers limited APIs and lacks SDKs for full customization. This makes it difficult to support advanced workflows, custom logic, or deeply integrated analytics features within your product.
- Operational Overhead Slows Teams Down: Configuration tasks like SSO setup, permissioning, and dashboard deployment can require significant manual effort—slowing down go-to-market timelines and adding technical debt.
For product-led teams building differentiated, user-facing experiences, these constraints introduce friction that compounds over time. If analytics are core to your application—not just a reporting layer—these limitations can impact delivery speed, user satisfaction, and long-term flexibility.
When Tableau Embedded Analytics May Be a Good Fit
Selecting an embedded analytics platform is about matching your product goals to the platform’s strengths and limitations. Tableau Embedded can make sense if your organization already relies on Tableau and needs to extend dashboards into an application quickly, especially when fast deployment, familiar workflows, or leveraging existing licenses are bigger priorities than deep customization or full UX control.
In these scenarios, Tableau Embedded helps you deliver analytics within your product without a major shift in technology or process.
It may be the right choice if:
- You’re Extending, Not Embedding: Your team already uses Tableau internally and needs to expose those dashboards externally without fully integrating analytics into your product experience.
- You’re Building Internal or Partner Portals: The audience is internal teams or trusted partners, not end-users who expect seamless UX, branding, or advanced interactivity.
- Visual Consistency isn’t Critical: Matching your app’s look and feel isn’t essential, and limited UI control or responsiveness won’t impact adoption.
- You’re Prioritizing Speed Over Customization: You need to deploy dashboards quickly and aren’t concerned with full front-end control, workflow integration, or custom user experiences.
In these cases, Tableau Embedded can deliver value without requiring a full platform shift.
When to Consider an Alternative
When analytics are central to your customer experience, every limitation in flexibility, integration, or cost predictability puts your product at risk. In fast-moving SaaS environments, these gaps can slow your roadmap, frustrate users, and make it harder to compete. That’s why it’s imperative to evaluate alternatives as a strategic move. This ensures your product delivers value, meets user expectations, and scales without constraint.
You may need to explore a Tableau Embedded Analytics alternative if:
- You Are Delivering a Productized Analytics Experience: Your users expect analytics to feel like a native part of your application, fully branded, tightly integrated, and aligned with your product’s design and behavior.
- You Need Predictable, Scalable Pricing: As your user base grows, usage-based pricing models make it difficult to manage cost structure and forecast spend confidently.
- You Require Full Front-End Control: Your team needs to own the layout, responsiveness, and interactivity of embedded components to maintain design standards and application flow.
- You Depend on SDK-Level Integration: Your product requires deep technical integration, with access to APIs and developer tools that support complex workflows, custom logic, and tight UX alignment.
In these cases, purpose-built platforms that focus on embedded analytics can offer a better fit for modern product requirements, especially when Tableau embedded pricing becomes unpredictable or restrictive for scaling SaaS applications.
How Reveal Compares as a Tableau Embedded Analytics Alternative
How Reveal Compares as a Tableau Embedded Analytics Alternative
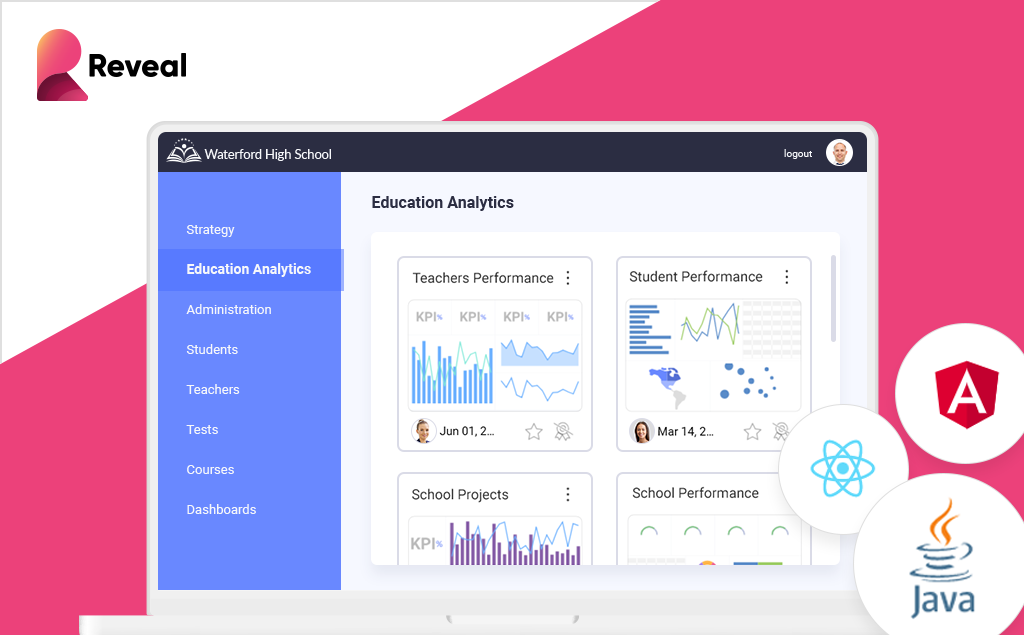
Reveal is built specifically for product teams embedding analytics into apps. Unlike legacy BI tools retrofitted for embedding, Reveal delivers a true SDK experience with full customization.
What you get with Reveal:
- No iFrames: Reveal uses native SDKs for .NET, Java, and JavaScript.
- Flat Pricing: No per-user or usage-based fees—only one fixed cost per year.
- Go Live 10X Faster: Most apps launch in under 4 weeks.
- White-label analytics: Match the look, feel, and behavior of your app exactly.
- Built-in AI: Get support for natural language queries and conversational BI.
Reveal gives your dev team full control while reducing the time and cost of delivering analytics to your users. Learn more about our Embedded Analytics and how we support White-Label Analytics.
Explore a side-by-side breakdown: Compare Reveal vs. Tableau
Final Thoughts
Choosing the right embedded analytics platform depends on what your application needs to deliver.
Key Takeaways:
- Teams that only need to share dashboards with internal users or partners may find Tableau Embedded sufficient for basic reporting tasks.
- Product teams building customer-facing applications that require analytics to match the UI, support deeper integration, and scale without unpredictable costs will benefit from Reveal’s developer-ready platform built for full control and long-term flexibility.
Learn more in our Build vs Buy blog or visit the Reveal Homepage to book a 1:1 call with a Reveal consultant.


