Using In-Memory Data Source to Expand Reveal's Data Reach

Using In-Memory Data Source to Expand Reveal's Data Reach

There may be times when you want to directly connect to a data source that Reveal might not support yet out of the box. For instance, you may have your own custom database. To accommodate this need, we support in-memory as a data source. You may also want to use this option if you need […]

Notice: Undefined variable: lang in /var/www/html/wp-content/themes/reveal/template-parts/blog-head.php on line 53 3 min read

There may be times when you want to directly connect to a data source that Reveal might not support yet out of the box. For instance, you may have your own custom database. To accommodate this need, we support in-memory as a data source. You may also want to use this option if you need to use data already in memory as part of your application state, such as the result of a report requested by a user.

In-memory data source also offers other benefits such as retrieval speed as it is much faster to access data in memory than on a disk drive. 

In this blog we’ll step through how to use this feature.

Defining a Data Schema

We recommend you define a data file with a schema that matches your in-memory data. Data files can be, for example, a CSV or Excel file, and a schema is basically a list of fields and the data type for each field. In the example below you’ll find details about how to create a data file with a given schema, and then use data in memory instead of getting information from a database.

In the following example, we’ll use in-memory data with the list of employees in the company in order to embed a dashboard showing HR metrics in your HR system. And instead of getting the list of employees from your database, we’ll use the data in memory.

Preparing the Data File and Sample Dashboard

Use the following steps based on a simplified Employee that only has a few properties:

  • EmployeeID: string
  • Fullname: string
  • Wage: numeric

First create the CSV file with the same schema:

 Example of preparing a Data File and Sample Dashboard in Reveal BI

  1. Upload the file to your preferred file sharing system, like Dropbox or Google Drive
  2. Create a dashboard using the dummy data. Please note that you are going to provide the real production data later in your application
  3. Export the dashboard (Dashboard Menu → Export → Dashboard) and save as a .rdash file.

Visualizing the Dashboard and Returning the Actual Data

Now you need to visualize the dashboard using your own data instead of the dummy one.

Implement IRVDataSourceProvider and return it as the DataSourceProvider property in IRevealSdkContext, as described in Replacing Data Sources.

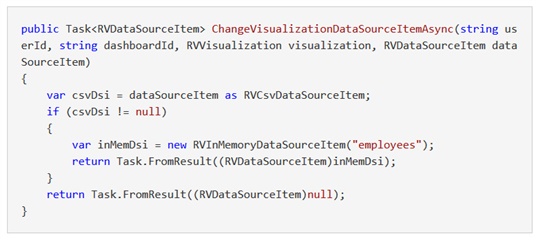
Then, in the implementation for the method ChangeVisualizationDataSourceItemAsync, you need to add a code similar to this one:

 Change Visualization Data Source Item Async example code

This way you basically replace all references to CSV files in the dashboard with the in-memory data source identified by “employees”. This identification will be used later when returning the data.

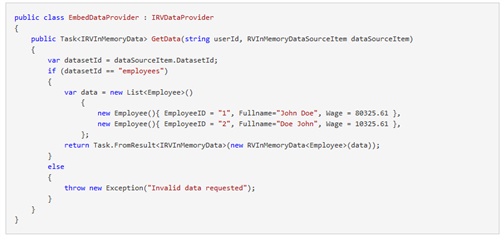
Implement the method that will return the actual data, to do that implement IRVDataProvider as shown below:

IRV Data Provider example code

Please note that the properties in the Employee class are named exactly as the columns in the CSV file, and the data type is also the same. In case you want to alter the field name, field label and/or data type of any of the properties you can use attributes in the class declaration:

  • RVSchemaColumn attribute can be used to alter the field name and/or data type.
  • DisplayName attribute can be used to alter the field label

 RV Schema Column attribute can be used to alter the field name and/or data type

In addition, to implement IRVDataProvider you need to modify your implementation of IRevealSdkContext.DataProvider to return it:

  IRV Data Provider implementation

To learn more about Reveal or trial the SDK if you haven’t yet done so, please visit the Reveal webpage.

How to

MORE TOPICS

Reveal update
Deprecated: Function WP_Query was called with an argument that is deprecated since version 3.1.0! caller_get_posts is deprecated. Use ignore_sticky_posts instead. in /var/www/html/wp-includes/functions.php on line 5697
Request a Demo
/jp

Accelerate Insights with Self-Service Embedded Analytics

Reveal is a business intelligence solution that is purpose-built for embedded analytics. Deliver full-featured self-service dashboards and modern reporting with a beautiful, branded experience in any JavaScript framework, Windows Forms or WPF application. Deploy to any cloud – public or private – or your own on-prem servers.

Request a Demo Download SDK

Using In-Memory Data Source to Expand Reveal's Data Reach

Reveal analytics overview illustration

Why Choose Purpose-Built Embedded Analytics?

Most of today’s embedded analytics solutions are simply iFrames embedded in a Web View in an application. With a purpose-built embedded analytics solution, you get complete control over your own app experience – which features to show and hide, how your dashboards are branded, how security is implemented, and where your app is deployed.
With Reveal as your embedded analytics solution, there is no compromise in features and functionality, all while driving data-driven decisions across your organization.

Top Embedded Analytics Features Your Customers will Love

Simple & Beautiful User Experience

Transform and grow your product with custom dashboards and data visualizations. Gain a competitive advantage by enabling storytelling with data and showcase your business data in context and in real-time by embedding beautiful and interactive data visualizations into your apps.

SEO

SEO

Match Your Brand Experience

Since Reveal is an embedded BI solution, it needs to match your UX. You have complete API control over how Reveal looks and behaves in your application – fonts, background & foreground colors, visualization colors palettes, and more give you 100% control over your app UX.

Works on Any Platform

Reveal’s native web, desktop & server SDKs can be integrated into applications on any platform and tech stack including .NET Core, Java, NodeJS and front-end technologies such as JavaScript, React, Angular, Web Component, VueJS, jQuery, MVC and Java Frameworks like Spring, Tomcat, Apache.

Apache Tomcat logo
ASP NET Core logo
Java logo
Spring logo

Node JS logo
React logo Angular logo Web components logo Vue.js logo jQery logo ASP.NET MVC logo

SDK Features for Optimal Developer Productivity

Connect to Any Data Source

Connect to Any Data Source

Dozens of Connectors, including REST, Postgres, JSON, CSV. Excel, SQL Server, Analysis Services, Google Big Query, Azure SQL, Azure Synapse and more.

Deploy Anywhere

Deploy Anywhere

With Reveal, you are in charge of deployment. Reveal runs on Windows, Linux, or Mac servers, with backend SDKs for .NET, Java and NodeJS. Deploy on-prem, or to any cloud or any container in the cloud!

Secure by Default

Secure by Default

Data access is controlled by you. You have complete control over queries, parameters and filters that are sent to your data sources. We have added capabilities to support multi-tenant backends, and row-level filtering for per-user security.

Rich Client & Server API

Rich Client & Server API

Every aspect of Reveal is configurable via properties, functions, and events in a rich API in both the client and server SDK’s. With Reveal, you can override every aspect of interactive behavior, how dashboards are loaded and saved, and what UI features are available to users.

Embedded Analytics Video Tutorials

Get started with the resourses you need to create simple and beautiful dashboard

View All Video

Frequently Asked Questions

Reveal is an embedded analytics solution that provides organizations with the most powerful, flexible and transparently priced analytics tools on the market. Reveal provides developers with a wide range of highly customizable and easy-to-use embedded analytics tools and data visualizations, which end users can immediately understand.

Reveal brings the power of data to the hands of your employees, customers, partners, suppliers and yourself. It provides interactive dashboards, drilldowns, collaboration, sharing and true self-service with a drag and drop dashboard creator experience on any device that lets anyone build beautiful dashboards in their apps and act at the right moment.

Price varies depending on your need but is always one-simple fixed price. We have no hidden fees, usage or users’ tiers. To get a price, you can request a quote on this link.

Creating a dashboard in Reveal is very easy. First, you need to connect to a data source that contains your data and then create beautiful visualizations to convey the meaning and message of the insights that you get. After that, you can save your dashboard and share it with everyone that needs to have access to that data.

Reveal’s native SDKs can be integrated into applications on any platform and tech stack including .NET Core, Java, NodeJS and front end technologies such as React, Angular, WebComponent, VueJS, jQuery, MVC and Java Frameworks like Spring, Tomcat, Apache.

Reveal is based on a cloud architecture that includes multiple authentication methods, local caching of data to minimize sending of queries to servers and databases, and much more. You can read more about Reveal’s security here.

The SDK server-side component is a set of ASP.NET Core libraries (supporting both .NET Framework, ASP.NET Core and Java), this allows the deployment into both on-premises or cloud applications.

Request a 30-Min Demo!

Choose a convenient time slot to schedule your 30-minute demo. Or fill out the
form below and we will be in touch to schedule your demo.


Embedded Analytics Blogs

Recent Blogs Posts about Reveal

Read the latest about analytics and visualizations. View more blogs.