
Is Power BI Embedded Analytics the Right Tool for Your Business Needs?
Power BI Embedded allows developers to integrate interactive dashboards and reports into their applications using Microsoft's ecosystem. However, challenges like complex pricing, limited customization, and performance issues at scale often prompt teams to explore more flexible alternatives like Reveal.
Executive Summary:
Power BI Embedded is a go-to choice for adding interactive analytics to apps, especially for teams already working in the Microsoft ecosystem. It lets you embed dashboards, reports, and visualizations using Azure infrastructure and familiar tools like Power BI Desktop. But as projects scale, some teams start to hit limits. Whether it’s pricing complexity, performance with large datasets, or design flexibility, Power BI Embedded isn’t always the best long-term fit.
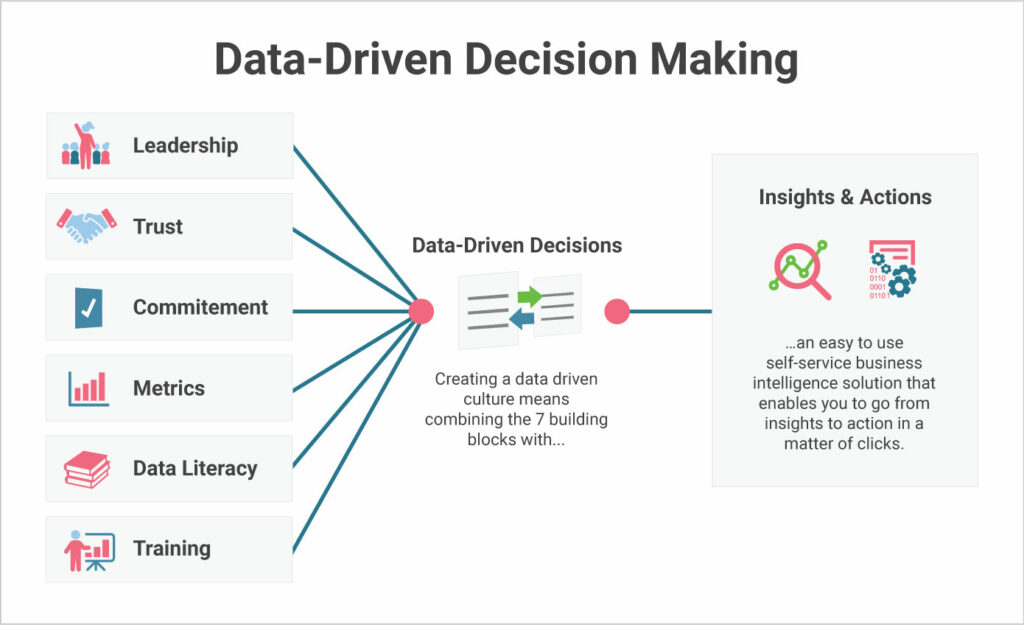
Choosing the right embedded analytics solution to partner with often makes or breaks your business. Nowadays, a company relies heavily on data in almost any capacity, no matter how big or small. Whether for their daily workflow and operations, marketing and sales performance, or strategizing, embedded analytics eliminates the guesswork and replaces gut-based decisions with data-driven solutions.
Flexible, easy-to-use embedded analytics aren’t just an advantage—they’re the standard in highly competitive, oversaturated industries—where smarter, faster decisions made with accessible data can tip the scale in your favor.
Power BI Embedded is arguably the most famous embedded analytics solution. As a Microsoft product, it will likely be the first in line when researching potential solutions. However, being first in line doesn’t make you the best. So, let’s talk about the good, the bad, and the truth about Power BI Embedded.
What Is Power BI Embedded?
Microsoft Power BI is a cloud-based BI and analytics service that is somewhat of an umbrella term. It includes a Windows desktop application (Power BI Desktop), an online SaaS service (Power BI Service), a mobile app, and an embedded platform.
The service offers two primary embedding solutions: “Embed for your customers” and “Embed for your organization.” The former is designed for external users who do not need to sign in with Power BI credentials, making it suitable for independent software vendors (ISVs) developing applications for third parties. The latter targets internal users who authenticate using Power BI credentials, ideal for large organizations building internal applications.
So, teams can use Power BI’s analytics engine instead of building visualizations from scratch to bring data insights into their app experience. However, everything is still managed within the Azure environment, so your backend will always have to talk with Azure to authenticate and access Power BI content.
So, even though Power BI is, without a doubt, a powerful tool, its architectural decisions, platform dependencies, and pricing complexities disqualify it as a one-for-all embedded analytics solution.
So, who is the ideal customer for Power BI Embedded?
Who is Power BI Embedded for?
Unsurprisingly, Power BI is best suited for developers and teams already working within the Microsoft stack. Teams using Azure infrastructure, Power BI Desktop, and Azure Active Directory for authentication will benefit most from the product. It’s a natural fit for organizations with standardized Microsoft tools that want to extend analytics to users without giving them direct access to the Power BI Service.
The platform is also commonly used by SaaS companies and ISVs looking to embed reports for their customers. The licensing model offers an “embed for your customers” path that doesn’t require end-users to have Power BI accounts. This makes it well-suited for multi-tenant platforms where users need secure access to analytics.
Getting full value from Power BI Embedded typically requires deeper technical integration, careful capacity planning, and a willingness to manage Azure-based resources. It’s a good match for teams already structured for that kind of operational overhead.
Still, even if you are comfortable using Azure infrastructure, that doesn’t mean Microsoft’s solution is perfect for your teams.
So, learning more about the Power BI Embedded pros and cons will help you determine whether the platform is the right fit.
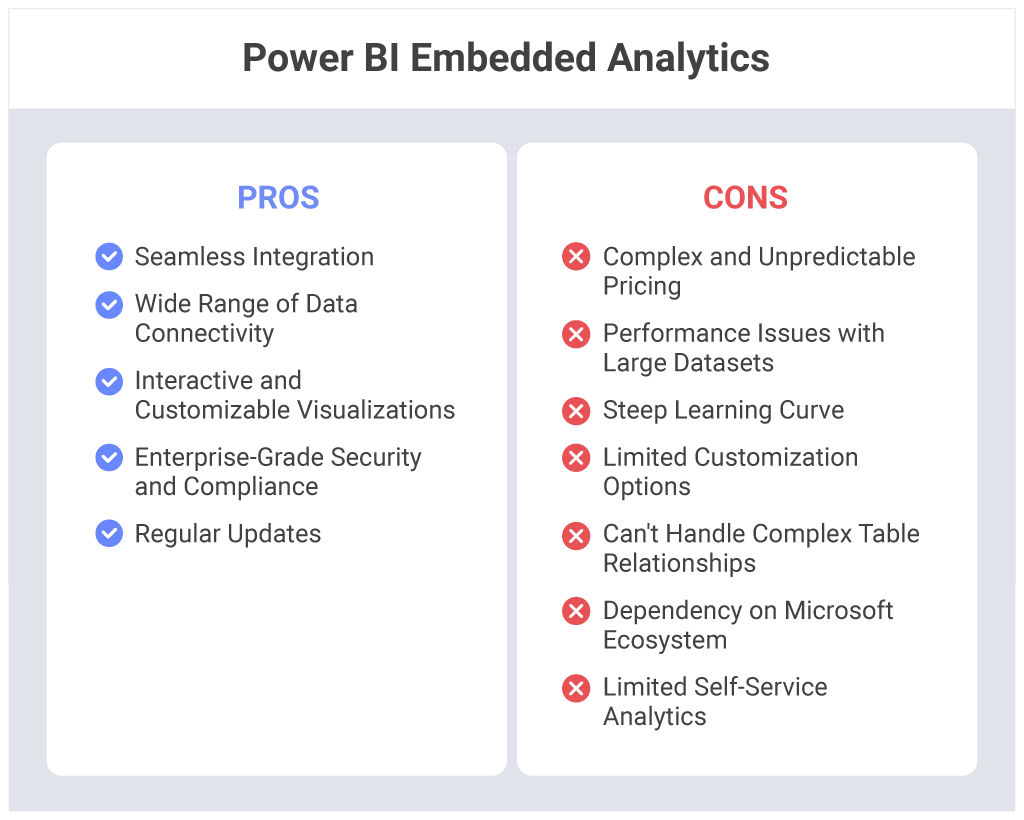
Pros: Why Do Companies Like Power BI Embedded?
Power BI Embedded delivers a solid performance and experience for the right user case. It removes the need to build analytics infrastructure from scratch and plugs effortlessly into Microsoft-based environments. However, due to its exceptional benefits, Power BI Embedded became a name among developers.
Seamless Integration
Power BI Embedded is built for application embedding. Developers can easily embed reports into web or mobile applications using Microsoft’s JavaScript SDK and REST APIs. Once configured, users don’t need a separate Power BI account to view the content, which is especially helpful for customer-facing SaaS platforms. The process isn’t completely plug-and-play, but the integration is relatively straightforward for teams familiar with Microsoft’s ecosystem.
Wide Range of Data Connectivity
Power BI supports a large number of data connectors, ranging from on-prem SQL databases and Azure Services to third-party cloud platforms like Salesforce, Google Analytics, and Dynamics 365. This flexibility is a strength for teams pulling in data from multiple systems, allowing them to unify their reporting without building complex custom integrations or ETL pipelines.
Interactive and Customizable Visualizations
In addition to the general data visualizations available on Power BI, you can also use custom visualizations in your reports and dashboards, i.e., visualizations made by developers for specific use cases. There is a KPI visualization, graphs, charts, maps, R script visuals, and more. One Power BI report can include multiple visualizations.
Enterprise-Grade Security and Compliance
Being part of Microsoft Azure, Power BI Embedded inherits enterprise-level security standards, including encryption, role-based access control, and integration with Azure Active Directory. For regulated industries such as finance, healthcare, and government, Power BI Embedded aligns with frameworks such as ISO 27001, HIPAA, and GDPR.
Regular Updates
Microsoft is thorough with upkeeping their platform. Updates are released monthly—like clockwork—including new visual types, UX enhancements, performance optimizations, and security patches. This helps teams stay current without manually patching or rebuilding embedded dashboards.
Unfortunately, while Power BI Embedded has its fair share of benefits, more often than not, the downsides overshadow them.
Cons: Why Do Companies Look for Alternatives?
Whenever researching a software solution, you must pay close attention to the trade-offs. Power BI Embedded is no different. For each brilliant solution, there is something they missed. As your usage grows, these limitations will become hard to ignore.
So, let’s have a closer look at Power BI Embedded’s downsides and how they will affect your app’s performance.

Complex and Unpredictable Pricing
Power BI Embedded uses capacity-based pricing through Azure SKUs (like A1–A6). This means you’ll pay for processing power, not users. Capacity-based pricing might work for small apps with stable usage, but predicting costs as data grows or usage spikes becomes difficult. Users share this general concern on third-party platforms like Quora and Reddit and reviewer websites such as G2 and Capterra. Costs start reasonably but quickly escalate, sometimes double, triple, or even quadruple compared to fixed-priced alternatives.
Performance Issues with Large Datasets
Power BI Embedded users also complain about performance difficulties when using high-volume datasets. Report load times increase and interactivity can lag, especially if you’re not on a higher-capacity tier. This will become a bottleneck for organizations delivering real-time dashboards or analysis to stakeholders. Regardless, the only solution Power BI Embedded offers is to add Azure capacity (thus significantly increasing the cost).
Steep Learning Curve
Power BI is intuitive and easy enough to use if you are using it to simply import data and create basic reports. However, Power BI is an entire suite of interrelated tools for advanced analysis. So, if your purpose is to create more than just basic reports, you will need to learn and master several other tools such as Power BI Report Server, Power BI Services, Gateways, and others.
Moreover, Power BI embedded requires familiarity with too many programming languages like Power BI Desktop, DAX, Power Query, and Azure services. This learning curve can slow adoption for non-technical users or product teams that want to move quickly. Even embedding workflows have setup requirements that may feel heavy compared to more modern, true SDK-based approaches.
Limited Customization Options
While Power BI allows some branding adjustments, full white labeling is not supported. Dashboards still carry Power BI’s design patterns, and deeper UI customization typically requires workarounds. This can be limiting for companies that want analytics to blend seamlessly into their own UX or follow strict brand guidelines.
Can’t Handle Complex Table Relationships
Power BI is good enough for handling simple relationships between tables in a data model. But, if there are other, more complex relationships between tables (if they have more than one link between tables, for example), Power BI cannot handle them well. Sometimes, you will have to make unique fields in tables to join them together.
Dependency on the Microsoft Ecosystem
While you can embed Power BI into apps hosted outside Azure, the platform still relies on Azure services, including Azure AD for authentication and the Power BI Service for report hosting. This tight integration makes it a drag for teams using more infrastructure-agnostic tools, AWS or GCP.
Limited Self-Service Analytics
Power BI Embedded is designed for viewing prebuilt dashboards. Giving end-users the ability to build or modify reports requires Power BI Pro licenses and access to the Power BI Service, which aren’t part of the embedded experience. So, this limitation becomes a major consideration for companies looking to give their entire teams or clients access to self-service. Purchasing Power BI Pro licenses for all who need access to self-service analytics can easily drive the cost into five or even six figures.
What to do When You Outgrow Power BI Embedded
Without a doubt, Power BI Embedded covers a lot of ground. However, it was built with a specific scenario in mind. Stepping outside those boundaries often leads to significant cost escalation and, more importantly, unpredictable challenges.
As products scale, so do user expectations. Internal teams push for more flexibility, and stakeholders require the freedom to build their dashboards. Inevitably, companies will hit a point where they need something more customizable, more cost-predictable, or simply less dependent on the Microsoft ecosystem.
That’s often when teams start looking for alternatives that offer native SDKs, full white-labeling, and pricing models that won’t spiral with usage. For example, some developers want complete control over the front-end experience or need to deploy analytics in non-Azure environments. Others are building customer-facing platforms and need embedded analytics to feel like part of their product—not a bolt-on.
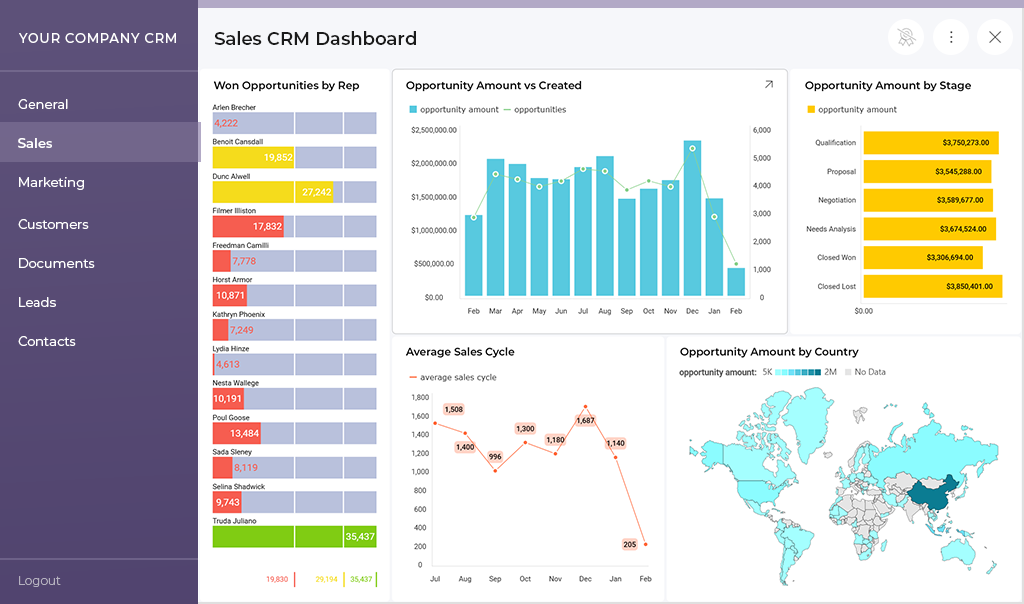
If that’s your case, Reveal is often the tool that tends to come up in these conversations on Reddit, Quora, or other third-party platforms.
It’s designed from the ground up for embedding, with developer-friendly SDKs, flexible deployment options, unlimited developer control, and effortless self-service analytics capabilities. Most importantly, Reveal was built with enterprise-level scalability in mind. This includes zero performance issues regardless of the size of the data set or the number of users operating simultaneously.
Best of all, the platform has a flat, predictable, and transparent pricing model. This means you won’t pay anything on top, regardless of how fast or how much you scale.
To see how Reveal compares side-by-side with Power BI Embedded—on pricing, customization, architecture, and more—check out the full breakdown here:


