Reveal 1.6.0 Features Are Here!!
Introducing custom visualizations, interactive chart filtering and a host of other enhancements and bug fixes that help us provide you with the best embedded analytics solution you deserve.
Executive Summary:
Welcome to Reveal 1.6.0! This release brings a host of enhancements, bug fixes, and exciting new features that will refine the way you interact with your data.
In this blog post, we’ll dive into the key highlights, with a particular focus on two standout features: custom visualizations and interactive chart filtering.
DIY Custom Visualizations with Reveal
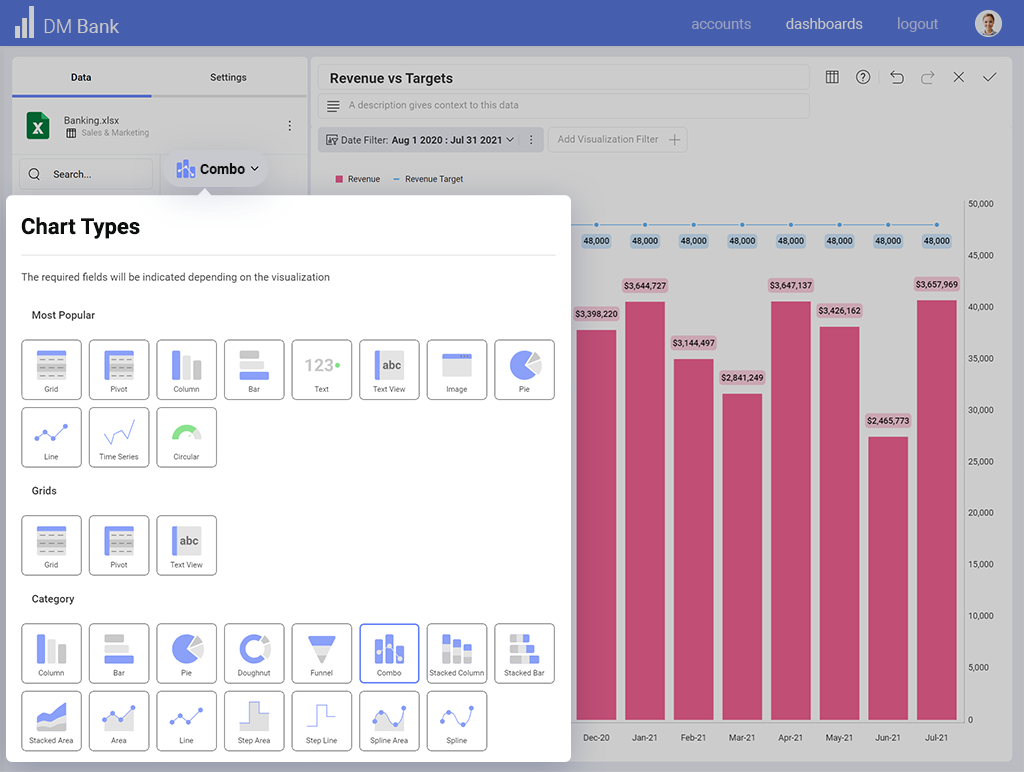
With this innovative addition to our platform, you can now control the chart types available within your dashboards. Tailor the experience for your users by removing any of our default chart types that may not be relevant to your specific needs. Create customized groups to organize the chart types efficiently, ensuring an intuitive and user-friendly interface.
What’s more, you can instantly incorporate your custom visualizations, replete with names and icons, with just four lines of code, bringing up a universe of possibilities for showing your data in new and exciting ways.
1. Update Chart Type: To update an existing chart type, find the chart type in the revealView.chartTypes property. Modify the various properties of the chart type to either rename, change the icon, or regroup the chart type item.
var barConfig = revealView.chartTypes.find(x => x.chartType == 'BarChart');
barConfig.title = 'My Cool Bar';
barConfig.icon = 'https://help.revealbi.io/img/logo.png';
barConfig.groups = ["Enterprise Visualizations", "HR", "Some Other Category"];
2. Remove Chart Type: Remove a chart type by finding the index of the chart type item you want removed, and remove it from the chartTypes array.
var gridConfig = revealView.chartTypes.find(x => x.chartType == 'Grid');
revealView.chartTypes.splice(revealView.chartTypes.indexOf(gridConfig), 1);
3. Add Custom Chart Type: Besides updating and removing existing chart type items, you can also add your Custom Visualizations as a new chart type in the Chart Types drop down.
revealView.chartTypes.push({
    title: "Custom Viz",
    url: "https://host/customViz.html", //provide the url to your custom visualization
    icon: "https://help.revealbi.io/img/logo.png",
    groups: ["Custom Visualizations"]
});
Interactive Chart Filtering
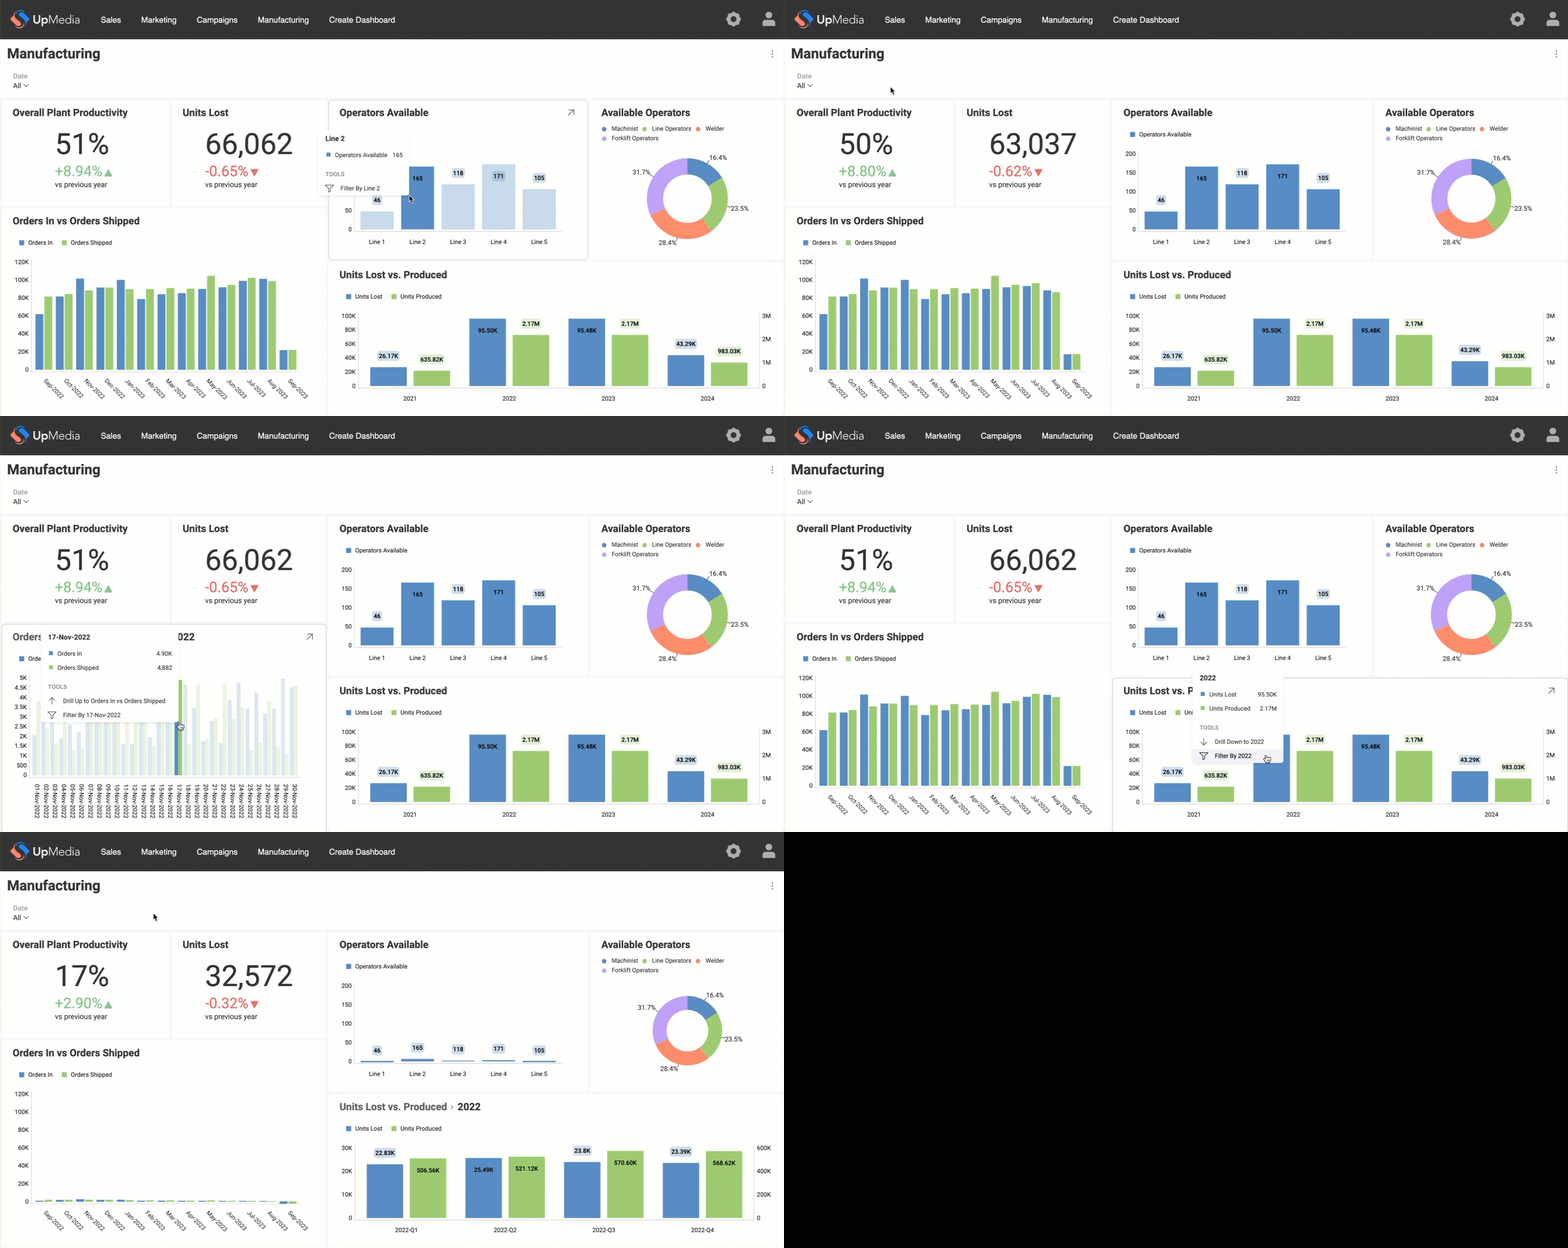
Reveal’s latest 1.6.0 release introduces Interactive Chart Filtering, a dynamic data manipulation feature that puts the power of real-time data exploration at your fingertips. This seamless and intuitive experience allows you to filter your entire dashboard on the fly, revolutionizing the way you interact with your data. Here’s how it works:
- Enable chart actions available while hovering the mouse. To turn on, use:
revealView.interactiveFilteringEnabled = true;
$.ig.RevealSdkSettings.enableActionsOnHoverTooltip = true
- Hover and click over any data point within your chart to dynamically filter your dashboard to that specific data point.
- You can continue to add additional filters and remove filters as your dashboard reflects your selections in real-time.

With this dynamic feature, you’ll effortlessly gain the insights you need to answer your data-driven questions, making data exploration more engaging and intuitive than ever before. Say goodbye to manual filter input and welcome a more dynamic and responsive data discovery with Reveal.
Here Is All That’s New in Reveal 1.6.0:
Breaking Changes
All Platforms
- Changes in license keys: In Reveal 1.6.0, license keys are now mandatory, even for the SDK trial mode. This change ensures better security and accountability. The license format has also been updated. Reach out to your sales representative to acquire your new license key or register for a SDK trial key here.
- availableChartTypes property has been removed. Its replacement is the ‘chartTypes’ property described in the ‘New Features’ section below.
- The dependency to ‘libgdiplus’ has been removed to enhance our cross-platform performance.
- The SDK no longer depends on Quill.js.
ASP.NET
- Most data sources have been removed from the core package. They’re now available as separate packages. Data source packages are REQUIRED to be registered. The information about the supported data sources and the corresponding add-in nuget packages can be found here.
- Reveal now requires .NET 6.0 or newer.
- Data related objects have been moved into the Reveal.Sdk.Data namespace.
- Data Source objects (ex: RVSqlServerDataSource) have been moved into their respective namespaces (ex: Reveal.Sdk.Data.Microsoft.SqlServer).
New Features
All Platforms
- Ability to add custom visualization as Chart Types in the visualization editor. The new ‘chartTypes’ property allows this, as well as modifying the icon, title and grouping of existing chart types, or making them unavailable.

- Reveal 1.6.0 introduces a beta feature that adds a layer of interactivity to your charts. By enabling ‘Chart actions on hover’ using $.ig.RevealSdkSettings.enableActionsOnHoverTooltip = true, you can access information and functionality without needing to navigate through menus, making data exploration faster and more intuitive.
- Calculated fields now support decimals specified without a leading ‘0,’ (e.g., ‘.5’ meaning ‘0.5’), offering more flexibility in your data calculations. Moreover, BigQuery data source now supports various calculated field functions, adding versatility to your analyses.
- Added support in BigQuery data source for the following calculated-fields functions: YEAR, QUARTER, MONTH, DAY, HOUR, MINUTE, SECOND, REPLACE, WEEKDAY, MONTHNAME, MONTHSHORTNAME, EMPTY, RANDBETWEEN.
- Copy & paste functionality now works seamlessly across browser tabs and page refreshes, ensuring that you can work efficiently without interruptions.
- RevealView now automatically resizes itself when its container changes size, enhancing the overall user experience.
- Stored procedure support has been added to the Oracle data source, opening up new possibilities for data analysis.
- Reveal now allows joining Athena data sources, making integrating and analyzing data from multiple sources easier.
Bug Fixes
All Platforms
Reveal 1.6.0 addresses numerous bugs and issues to provide a smoother and more reliable experience across all platforms, including:
- We’ve resolved the issue where pushing multiple menu items with menuItem action functions called only the last action function, ensuring that your menu items work as expected.
- The Donut chart now correctly displays legends for <null> values and accurately represents your data.
- Exporting to PDF will now adhere to the assigned theme, ensuring consistent branding and style in your exported reports.
- You can now comfortably click on the “X Selected” or “Show All” text within a filter, making data filtering more intuitive.
- The cell background on filters for “X Selected” or “Show All” text now spans the full width, providing a visually pleasing and consistent interface.
- The custom theme font now correctly affects the KPI visualization, ensuring a consistent look and feel across your reports.
- The “No providerid specified…” error in the Oracle data source, defined on the JavaScript client, has been resolved for uninterrupted data retrieval.
- The search bar in the data selection view now resets correctly in specific scenarios, improving user navigation.
- Searching tables in the data source dialog will no longer cause errors or crashes, ensuring a stable experience.
- A DefaultRefreshRate of 0 will no longer prevent image and PDF web resources from loading as expected.
- Number formatting is now consistently applied in Sparkline, gauge tooltips, and other relevant visualizations, improving data readability.
- We’ve resolved the issue where the tooltip for gauges failed to display number formatting, ensuring that your data insights are more precise and easy to understand.
- We’ve addressed issues related to the “NUMERIC” data type, Quarter aggregation, and the “MOD” function, ensuring that BigQuery functions seamlessly in your analysis.
- BigQuery was missing quarter aggregation, but we’ve addressed this, allowing you to aggregate data by quarters seamlessly.
- The “MOD” function in BigQuery does not allow you to use two different types of numeric data (e.g. float64 and int64).
- The ‘Function does not exist’ error in Postgres when the schema is not set in the DataSourceItem has been fixed.
- Statistical functions are now correctly displayed when viewing data as a grid, providing more comprehensive data insights.
- Exporting to XLSX for charts visualizations now produces accurate results, maintaining the integrity of your visualized data.
- Inconsistencies in checkbox states while scrolling through a large list of data sets in the BigQuery add data source screen have been resolved.
- The BigQuery DataSourceItem now functions correctly when the project ID is set only on the DataSource.
- Data obtained from Excel cells with custom date formats will no longer be misinterpreted as date types.
- The Treemap visualization now correctly respects number formatting.
- Number formatting is now accurately displayed in the tooltip of Financial charts, enhancing your financial data analysis experience.
- Number formatting is now displayed accurately in the tooltip of the Radial chart.
- The 100k cell limit warning now displays correctly for Athena and BigQuery data sources.
- The Math function ‘Log’ is now working as expected for Athena data sources.
ASP.NET
- Export functionality, both headless and interactive, now works flawlessly on Linux systems, expanding your compatibility options.
- We’ve fixed compatibility issues when using Microsoft.Data.SqlClient version 5.0.0 or higher in ASP.NET projects, ensuring smooth integration with Reveal.
- The “Verify Credentials” error in the Oracle data source has been resolved, allowing for error-free data retrieval.
Node
- Request headers now function correctly for RVRESTDataSource when utilizing the Node SDK, ensuring seamless data connectivity and control.
Java
- Encoding issues in data read from BigQuery are now resolved, even if the system’s default charset is not UTF-8.
- You will no longer encounter null IRVUserContext issues in IRVDataSourceProvider.changeDataSourceItem in the createwidget API, ensuring a smoother data provider experience.
Final Words..
These bug fixes and enhancements reflect our commitment to delivering a top-tier embedded analytics solution that empowers you to harness the full potential of your data. Reveal 1.6.0 is designed to streamline your data analysis, making it easier than ever to gain valuable insights from your data and make data-driven decisions, and these new features are another step in that direction.
Your feedback is invaluable as we continue to enhance your Reveal experience to meet your evolving needs, so keep it coming.
Thank you for choosing Reveal!


 Return to Blog