
Autor
Bilyana Petrova
Bilyana es especialista en contenido Análisis integrado en Reveal. Desde la investigación hasta la escritura creativa, tiene la misión de hacer que los blogs de negocios aburridos sean útiles y procesables. Cuando no está en el trabajo, es difícil encontrarla, ya que le encanta descubrir nuevos destinos en todo el mundo, escalar picos montañosos y jugar con su adorable Laika siberiana. Para conocer su contenido más reciente y los últimos seminarios web de nuestros expertos, siga las redes sociales de Reveal: https://www.facebook.com/revealbi.io https://twitter.com/reveal_bi
Qué hacer y qué no hacer al incorporar análisis en sus aplicaciones
Si bien existen muchas tecnologías que facilitan la incorporación de análisis en sus aplicaciones, aún necesita tomarse el tiempo para asegurarse de elegir la mejor tecnología para su propio caso de uso comercial único.
Sigue leyendo...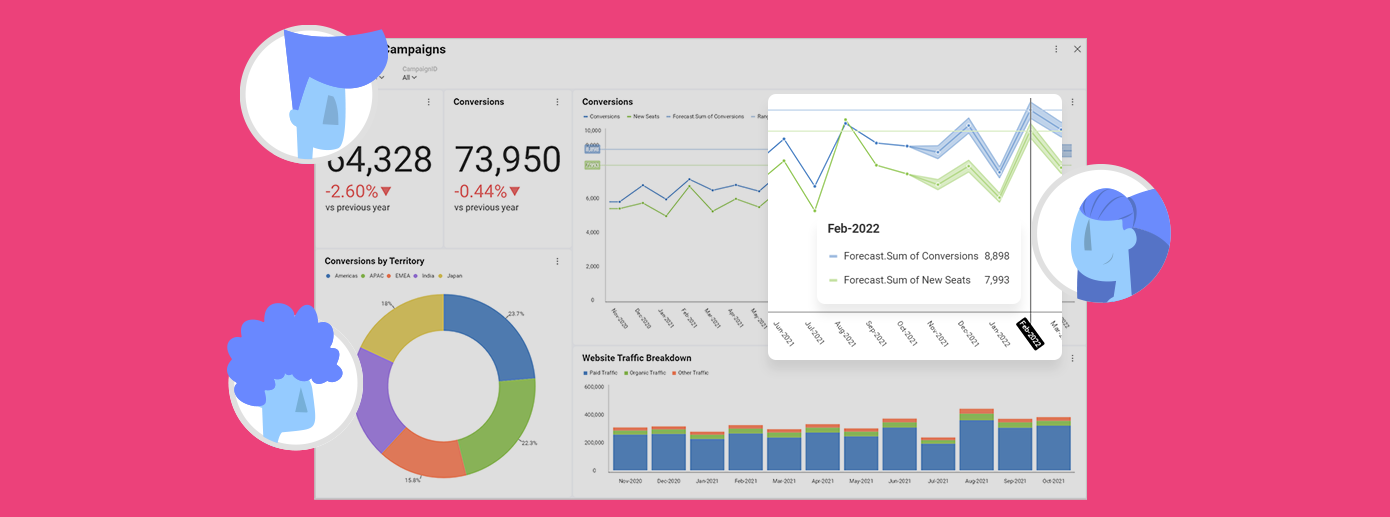
¿Qué es el análisis guiado?
El análisis guiado permite a una empresa configurar, con la ayuda de un desarrollador, aplicaciones comerciales que presentan paneles y gráficos que se actualizan en función de las exploraciones y los comentarios de los usuarios. El usuario final no tiene la capacidad de crear sus propias visualizaciones de datos, traer una de sus propias fuentes de datos o crear paneles e informes. Las operaciones de BI de análisis guiado son propiedad exclusiva del equipo de TI o de expertos dedicados en inteligencia comercial.
Sigue leyendo...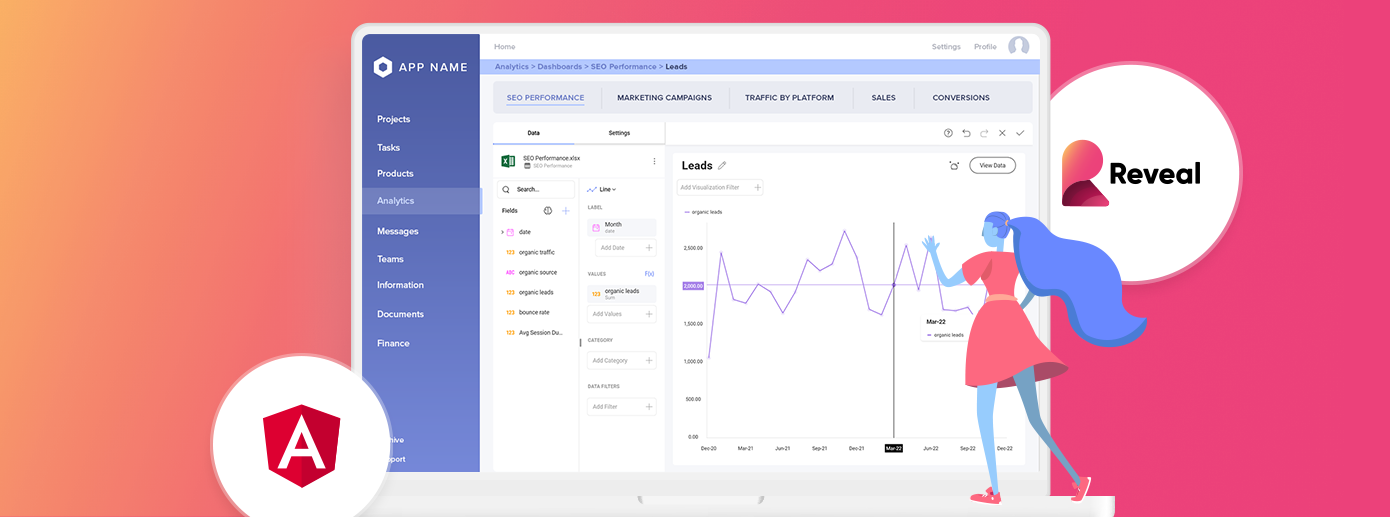
Incorporación de BI en sus aplicaciones de Angular
Al integrar una potente BI en sus aplicaciones Angular, puede optimizar los flujos de trabajo, administrar los recursos y optimizar el rendimiento. Los datos ayudan a las empresas a revelar dónde y cómo pueden mejorar, y a optimizar sus procesos y rendimiento generales para obtener la máxima rentabilidad
Sigue leyendo...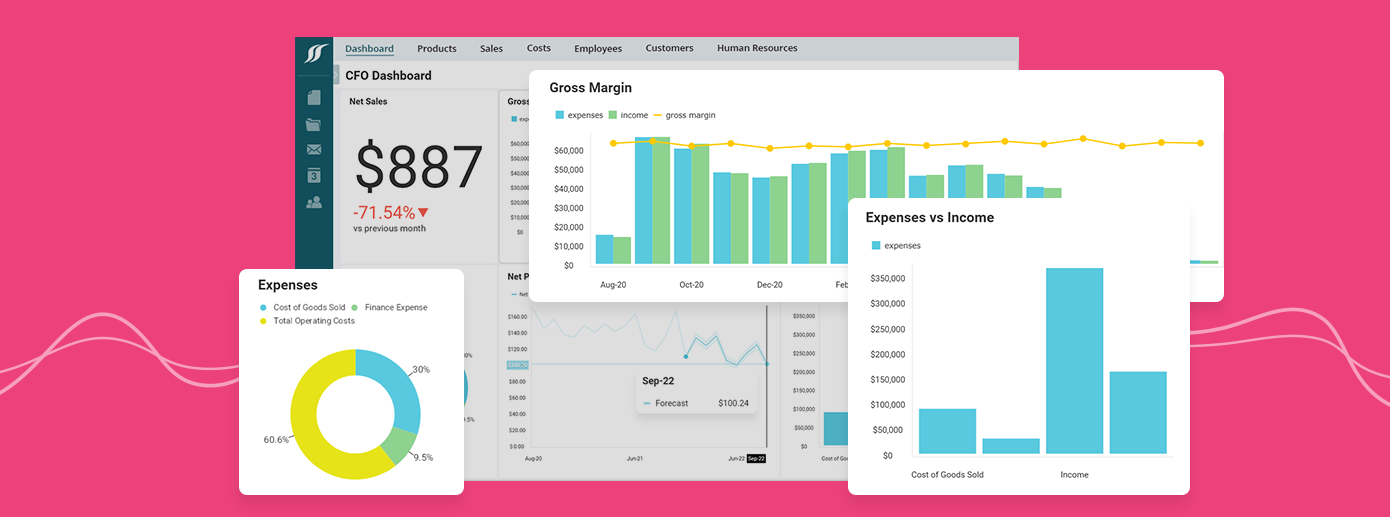
¿Qué es una aplicación analítica?
Las aplicaciones analíticas están diseñadas como aplicaciones independientes o análisis integrados para simplificar el acceso y la comprensión de los datos para todos los usuarios, independientemente de su experiencia. Proporcionan una vista lógica y contextual de los datos con los que trabajan los empleados de la empresa.
Sigue leyendo...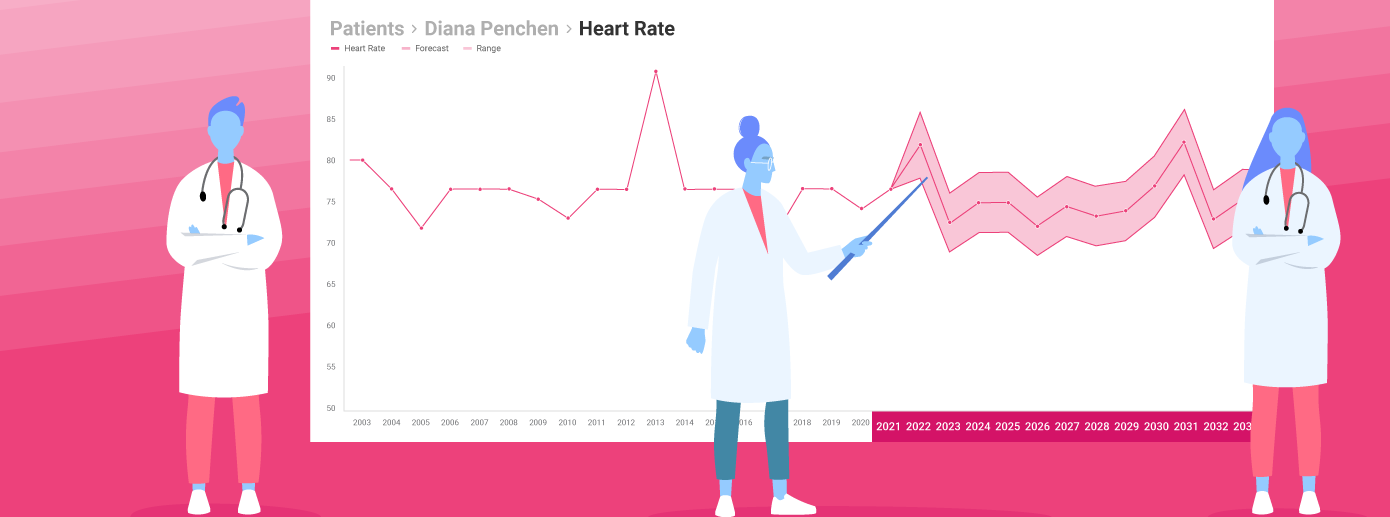
Análisis predictivo en el cuidado de la salud
El análisis predictivo en atención médica se refiere al análisis de datos de atención médica actuales e históricos que permite a los profesionales de la salud encontrar oportunidades para tomar decisiones operativas y clínicas más efectivas y eficientes, predecir tendencias e incluso controlar la propagación de enfermedades.
Sigue leyendo...
Reveal VS Looker para Análisis integrado; ¿Qué solución es mejor para ti?
En este artículo, analizamos más de cerca dos de las soluciones de análisis integrado más populares del mercado: Reveal y Looker, para ayudarlo a encontrar la mejor herramienta para sus necesidades.
Sigue leyendo...
Las 12 mejores plataformas Análisis integrado
Elegir la plataforma de análisis integrado incorrecta ralentiza su hoja de ruta, aumenta la carga de los desarrolladores y debilita la experiencia del producto. Muchas herramientas marcan las casillas de características, pero fallan en los modelos de precios, el control de integración, el ajuste de integración y la escala a largo plazo.
Sigue leyendo...
Guía de análisis aumentado: definición, ejemplos y casos de uso
Con la tecnología de dos de las mejores tecnologías de análisis, el análisis aumentado permite a los usuarios hacer preguntas y generar información automáticamente mediante la exploración de sus datos utilizando un lenguaje conversacional.
Sigue leyendo...
Chartio se va: elija a Reveal como su nuevo proveedor de BI
Chartio es una solución de análisis e inteligencia comercial basada en la nube que brinda a los equipos comerciales las herramientas y funcionalidades para la exploración y visualización de datos. Es una de las herramientas de visualización más populares del mercado que ayuda a los responsables de la toma de decisiones a crear gráficos, informes y paneles refinados, y a tomar las mejores decisiones en el caso más rápido. O solía serlo. Puedes […]
Sigue leyendo...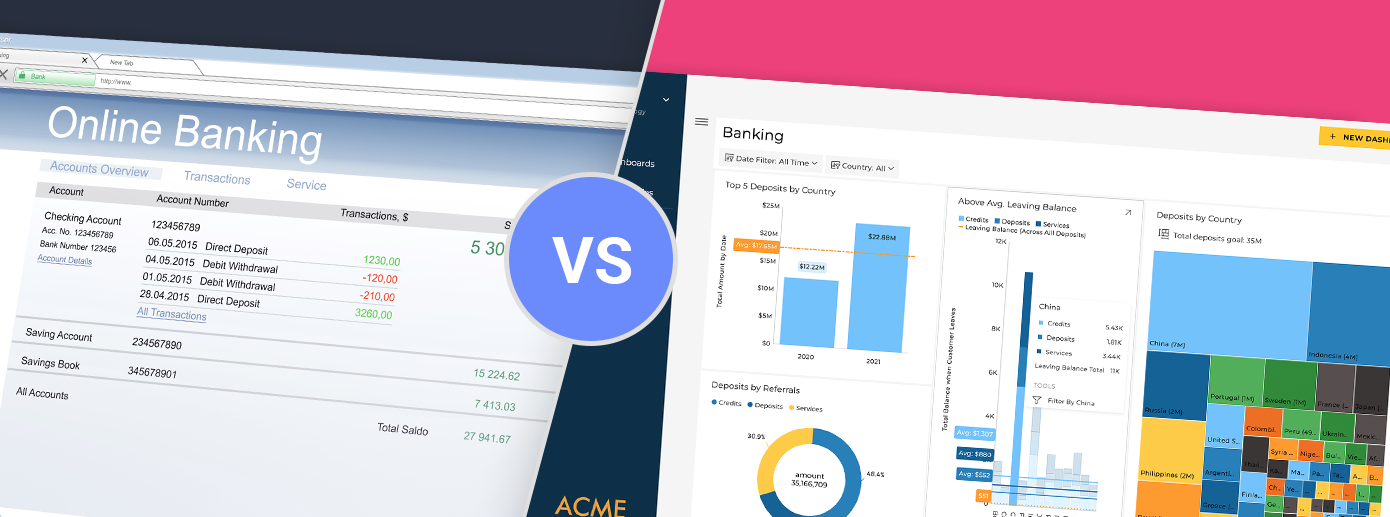
Sistemas heredados versus Análisis integrado modernos
Los sistemas de BI heredados crean deuda técnica, ralentizan la entrega de productos y limitan la experiencia del usuario. La analítica integrada moderna ofrece información de marca en tiempo real, arquitectura escalable y costos predecibles. Esta guía compara enfoques antiguos y nuevos, describe cómo elegir la plataforma adecuada y muestra cómo la solución basada en SDK de Reveal ayuda a las empresas SaaS y a los ISV a modernizarse sin interrupciones.
Sigue leyendo...

