Reveal 1.6.7 Is Here! Chart % Based Filtering, Enhanced Security for SQL Data Sources, and More…
We are thrilled to announce the release of Reveal 1.6.7. This release introduces a series of new powerful analytics features and enhancements designed to offer superior customization, deeper integration, and more robust analytics capabilities.
Executive Summary:
What’s New in Reveal 1.6.7?
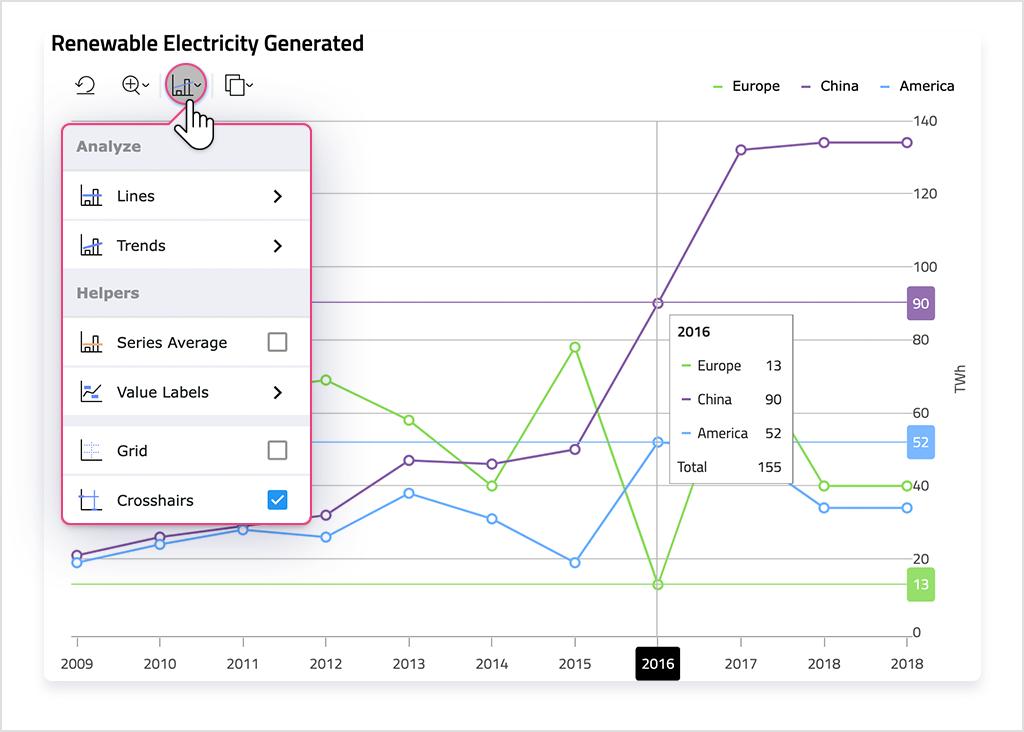
New Toolbar [Beta]
One of the standout features of this release is the introduction of the new toolbar. This updated toolbar enhances user experience by offering advanced data analysis and interactive features. Quickly access zoom, format charts on the fly, add trendlines and more!

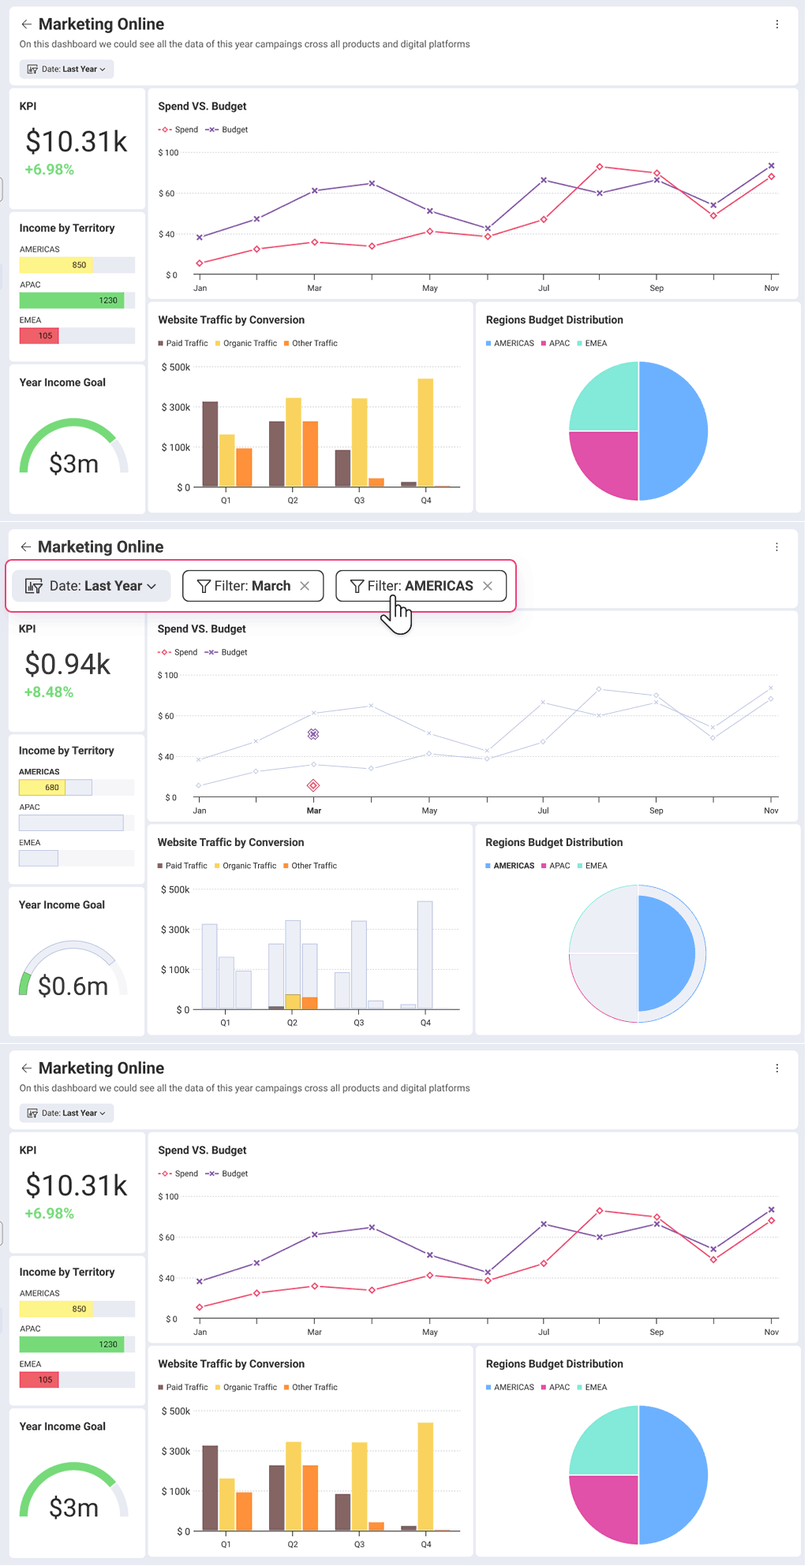
Chart % Based Filtering [Beta]
Chart % Based Filtering in Reveal enhances your dashboard’s interactivity by allowing percentage-based interactions across various visualizations. this feature enables a data point selected in one chart to dynamically influence and update other charts on the dashboard.
When you select a percentage value in one visualization, Reveal automatically adjusts other related visualizations to reflect this focus. This interconnected behavior helps you see how one segment of your data impacts others, providing a deeper understanding of relationships and contributions within your data sets.

Dashboard Loaded / Changed Event
With the new Dashboard Loaded / Changed Event feature, Reveal empowers developers to respond with custom logic when a dashboard is loaded or modified. By boosting application responsiveness and interaction, it allows immediate integration of custom actions upon data load or change.
Additional Enhancements
In addition to these new powerful analytics features, the Reveal X release also includes several improvements, including:
- Enhanced Security for SQL Data Sources: We’ve removed client-side custom query capabilities to bolster security and prevent risks like SQL injection.
- Alphabetically Sorted Tables: For better data management, tables in the data source dialog are now sorted alphabetically.
- New API for Visualization Filters: This API lets users access and manipulate visualization filter values directly, enhancing flexibility and interaction with data.
Bug Fixes
As with every release, our latest update addresses various bugs to ensure a more reliable experience. Fixes include improvements in Excel exports, date formatting corrections, and enhanced performance. For details, please refer to our release notes.
Final Words…
Reveal X reflects our commitment to delivering powerful analytics tools that meet the needs of our users. We continue to innovate based on your feedback and are eager to see how our enhancements help you drive better data analysis.
Your input is invaluable—please keep your suggestions coming! Contact our product team via Discord or email your feedback directly to CaseyM@revealbi.io.
Thank you for choosing Reveal as your embedded analytics solution!


 Return to Blog