Social Services Agencies Leave Paper and Excel Spreadsheets Behind

Meet Casebook
Initially incubated by the Annie E. Casey Foundation (devoted to developing a brighter future for millions of children and young people), Casebook is an industry-leading case management SaaS platform for the human services field.
-
Industry
Case management software -
Markets Served
Social services agencies -
Top Challenges
- Social services caseworkers have little experience with data analytics, but must report out regularly to government agencies and funders
- Casebook wanted an analytics solution with a simple UX that would be easy for non-technical users
- Casebook wanted an embedded analytics solution to slash time to market
-
Why Reveal
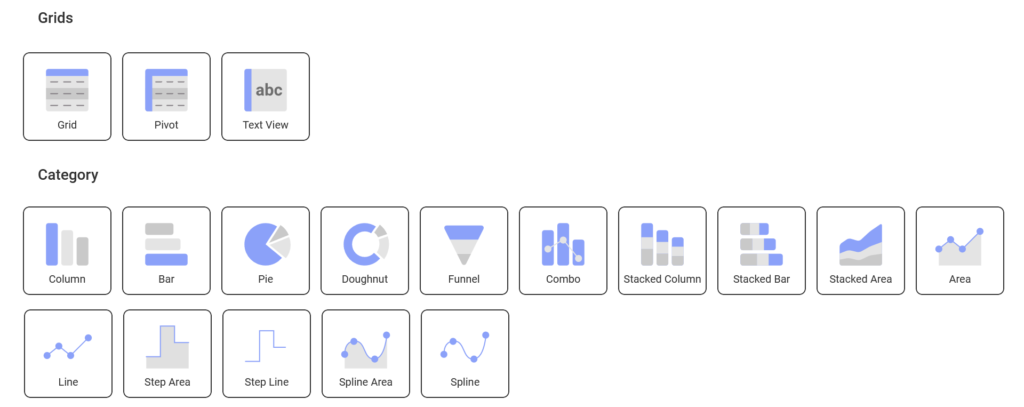
- Offers drag-and-drop simplicity
- Reports and dashboards are flexible, easy for case managers to customize
- Full Casebook integration lets users quickly visualize all data captured in Casebook into charts and dashboards
Casebook PBC’s solutions are a response to frustration among human services professionals and managers who have struggled with antiquated information systems and Excel spreadsheets as they aid and offer services to at-risk populations.
As a result, Casebook PBC developed a configurable, intuitive, and easy-to-use software in close partnership with human services practitioners.
Challenge
Social services organizations, not unlike their counterparts in the private sector, are accountable to various constituencies, including:
- Funders who want to measure the impact of their donations
- Licensing agencies who need to ensure professional standards are met
- Managers who need to track staff, client and program progress to achieve organizational goals
- Program leadership who evaluates staff compliance with practice models and builds Continuous Quality Improvement (CQI) plans
The ability to evaluate, report and manage data is key to meeting these demands. But for organizations without dedicated data staff, reporting can be expensive, time consuming, and a drain on teams hired to serve their communities, not crunch numbers.
“Social service workers are on the front lines, under high stress, with high turnover in their organizations,” says Ninad Amondikar, Data Product Manager at Casebook, “and they tend to have little experience with data analytics. Yet funders and other interested parties want to see data on their activities and programs, and this is difficult for most social service agencies.”
Many organizations rely on paper to take notes from calls with clients, family members or other social service agencies and to fill out forms for local or state reporting requirements. All this paperwork must be transferred into a computer for generating reports.
With its customers’ needs in mind, Casebook was designed with an intuitive user interface (UI) that would be simple for its non-technical customers to use.
For data analytics, they needed a reporting and visualization capability that integrated seamlessly into their software and would offer the same intuitive experience as Casebook software.
Solution
Casebook chose Reveal embedded analytics software to integrate real-time reporting, interactive data visualizations and advanced analytics into Casebook software.
“We really like Reveal’s intuitive UX because it appeals to our caseworker users,” says Amondikar. “Reveal makes it simple for caseworkers to run a report and see it in a beautiful chart or visualization that meets their reporting demands.
“We also like the flexibility and configurability of Reveal. Most other social services software and CRMs (Customer Relationship Management) software are rigid, offering pre-configured reports that can’t be modified.”

We really like Reveal’s intuitive UX because it appeals to our non-technical caseworkers. Reveal makes it simple for caseworkers to run a report and see it in an easy-to-read chart or visualization and meet their reporting demands.
Ninad Amondikar, Data Product Manager at Casebook
Flexible Pre-Built Reports
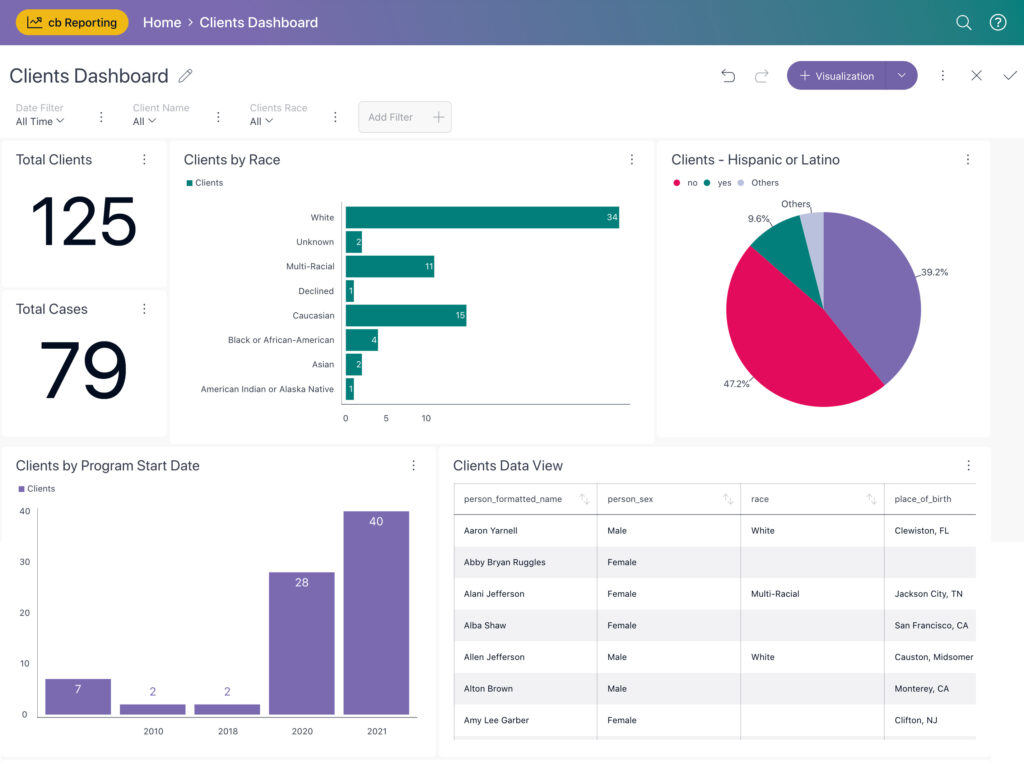
To help customers get up to speed more quickly, Casebook created pre-built reports and out-of-the-box dashboards. They also included Reveal dashboards on the Reporting module’s front page, capturing a snapshot of key metrics the customer is tracking at any given time. The pre-built reports allow users to dig deeper on the information that managers, funders, and other stakeholders require as part of evaluation, treatment coordination and fundraising.

“Someone who may not have any comfort with data can go into cb Reporting and leverage a library of pre-built reports,” says Amondikar. “It reduces the time that agency supervisors and program administrators spend setting up reports. The upfront investment required is minimal.”
Easy to Customize Reports
The cb Reporting module works in collaboration with the rest of Casebook’s product suite, taking data from the other modules, and turning them into customizable reports, covering the entire lifecycle of case management.
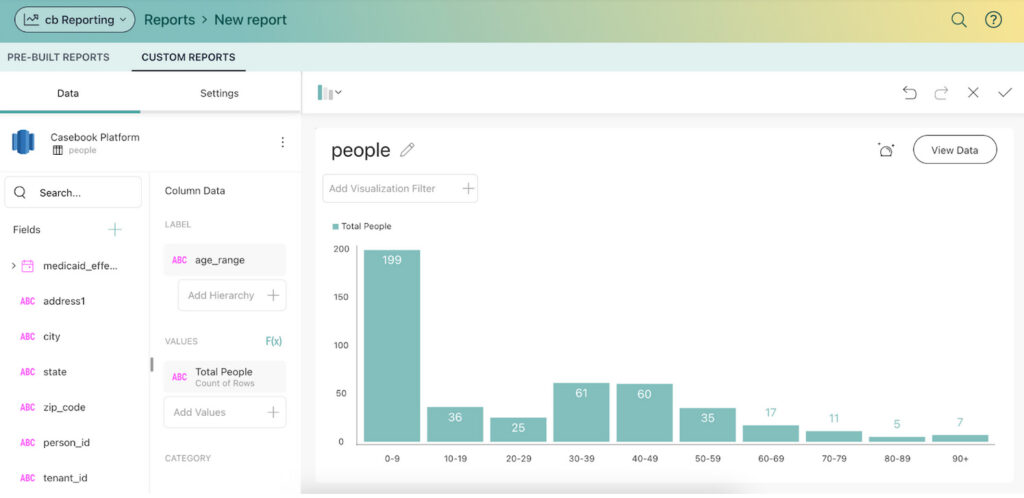
These reports and dashboards were created with the most essential human services reporting needs in mind. Just because the reports are pre-built doesn’t mean there isn’t room for customization. If an organization wants to run a report that includes some but not all the metrics in a pre-built one, they can simply filter out the information they don’t need or add a new data field with the click of a button.
If, for example, a manager wants to filter a particular report by race but not age, they can unclick the checkbox for age. Or, if a funder requests a specific new datapoint, it can be easily added. Users can save the changes for easy access in the future.
This frees caseworkers to continue their work in the field, using Casebook’s data entry system, while managers and administrators can easily track what’s happening from any device.

Funding Dollars to Increase with Professional Reporting
With Casebook’s pre-built reports, organizations can easily start reporting out how their activities are meeting grant requirements. Whether funders want stats on service delivery, demographics, client interactions, or any other data, these easily configurable reports and dashboards take the stress out of data collection, analysis, and reporting.
“While many of our customers are just getting up to speed with Casebook, we’re hearing stories of funders being extremely happy with the level of reporting,” says Amondikar. “And one thing that’s for sure: funders don’t want to waste their money. So when funders see their dollars being used wisely and validated in regular reports, they are more inclined to re-invest and we’re seeing that in some of our agency customers. It’s a win-win for everyone.”


