
Stay up to date with Reveal
Reveal business intelligence blog gives you the latest embedded analytics trends, how-tos, best practices, and product news.

How to Use Multi-Tenancy Data in Embedded Analytics
The multi-tenancy services reduce the complexity and customizations that are often required when embedding BI into your OEM software, ERP application, or other SaaS applications. Its capabilities allow you to easily maintain data isolation while supporting multiple tasks within the same account or organization at the same time.
Continue reading...
7 Embedded Analytics Features You Need From Your BI Vendor
The best embedded analytics solutions offer a lot more than just data visualizations. We gathered a list of 7 embedded analytics features you need to keep in mind when choosing your embedded analytics vendor.
Continue reading...
Using Stored Procedures in Embedded Analytics
Stored procedures are one of the most used and most popular database subjects and as such, they offer a handful of benefits. Using stored procedures can simplify and accelerate the execution of SQL queries, and more.
Continue reading...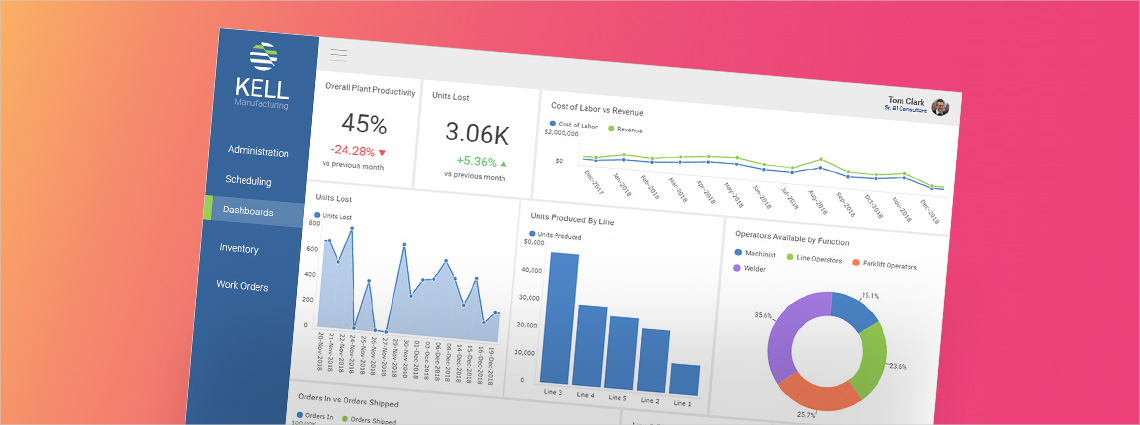
Why is ERP the Most Popular Embedded Analytics Application?
It’s important that analytics and visualizations are embedded within the ERP software itselfitself, so users don’t have to export the data to a separate application. And if the analytics are easy for business users to use with self-service capabilities, then more people throughout a company can do deeper dives into a range of pertinent business data.
Continue reading...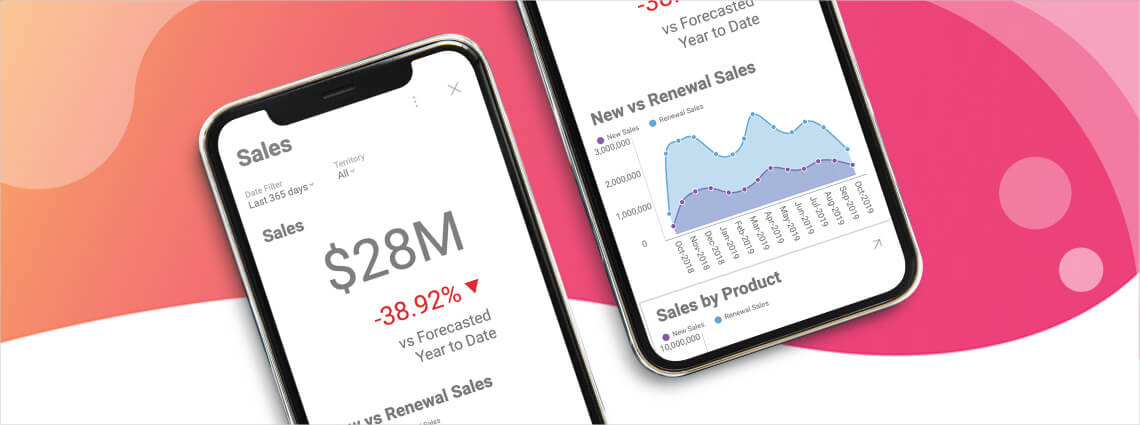
What is Mobile BI & Why is it Important?
Having company insights at your fingertips is the most valuable advantage of mobile BI. You are not limited to one computer in one location, but instead, you can access important data information on your mobile device at any time and from any location.
Continue reading...
Why You Need Data Driven Decision Making
Data-driven insights can help you identify business opportunities, detect customer journey leaks, and proactively identify weaknesses in your product before they grow into serious problems.
Continue reading...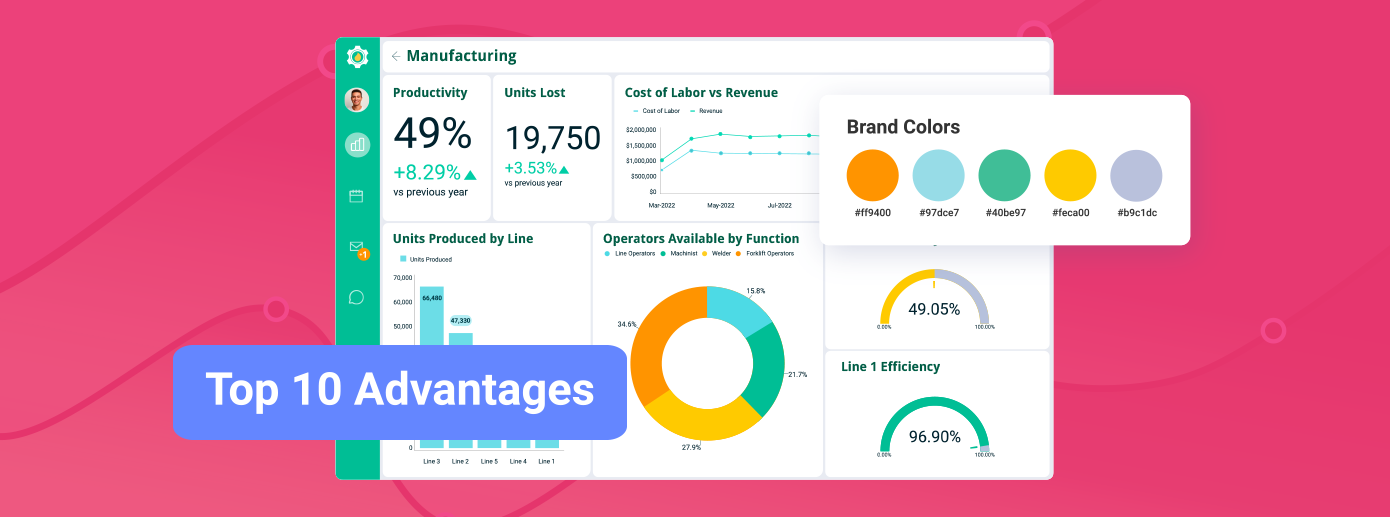
Benefits of Embedded Analytics: The Top 10 Advantages for Your Business
The real value of embedded analytics is how it strengthens products and business outcomes. It shortens development cycles, cuts costs, and keeps analytics inside the workflow where users need it. The biggest payoffs are higher adoption, predictable ROI, and new revenue through monetization. With SDK-first integration, white-label control, and AI-powered insights, embedded analytics delivers scale, flexibility, and a lasting competitive advantage.
Continue reading...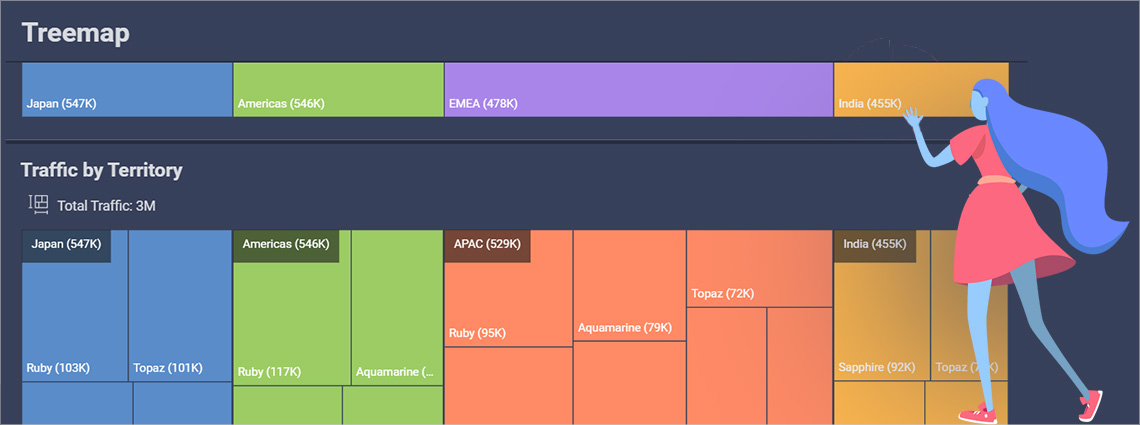
How to Create a Treemap Chart Visualization in Reveal
A Treemap Chart is designed for drill-down scenarios. It shows the relative weight of data points at more than one level allowing users to continuously drill down deeper into the data set that is represented by smaller rectangles for more efficient analysis.
Continue reading...

