Reveal Is One of the Highest Performing Embedded Analytics Software According to G2 Crowd
When choosing an embedded analytics solution to partner with, one of the best ways to determine whether a given solution provider is worth your time and money is to find out how satisfied its current customers are. Luckily, today there are many online platforms where users can share their feedback about the product they’re using, making it easier for others to make up their minds.
In the software space, G2, a peer-to-peer review site, is the largest and most trusted software marketplace, helping 60 million people make smarter software decisions based on authentic user ratings and social data every year. To help users even further, G2 creates yearly grid reports based on thousands of verified reviews and data from actual users, so you can compare multiple vendors based on real feedback.
As per G2’s official website, the G2 category Grid® Reports compare products in a given category based on satisfaction and market presence scores. In this whitepaper, we are going to focus on G2’s latest report on Embedded Analytics Intelligence vendors – the category in which our product Reveal has been rated as one of the leading embedded analytics products on the market.
Continue Reading
Fill out the form to continue reading.
Intro to G2 Report
The Grid® Report for Embedded Analytics Intelligence is a seasonal comparison report by the largest and most trustful software marketplace G2. The report compares top embedded analytics intelligence vendors based on feedback and reviews from real software users. That makes the report a highly trusted source of information as all the ratings and satisfaction scores are established thanks to those software vendors’ users’ experience.
G2 Grid® Report for Embedded Business Intelligence is entirely based on data sourced from product reviews shared on the G2 platform by its users and on data collected from online sources and social networks.
The report aims to provide business owners, product managers, CTOs, and company decision-makers with an objective guide on how different vendors are performing and help them make the best possible investment decision. Also, for vendors, investors, and analysts, the G2 report provides a clear understanding of their competitors and benchmarks for market trend analysis.
Reveal Positioning in the G2 Grid® Report for Embedded Analytics Intelligence
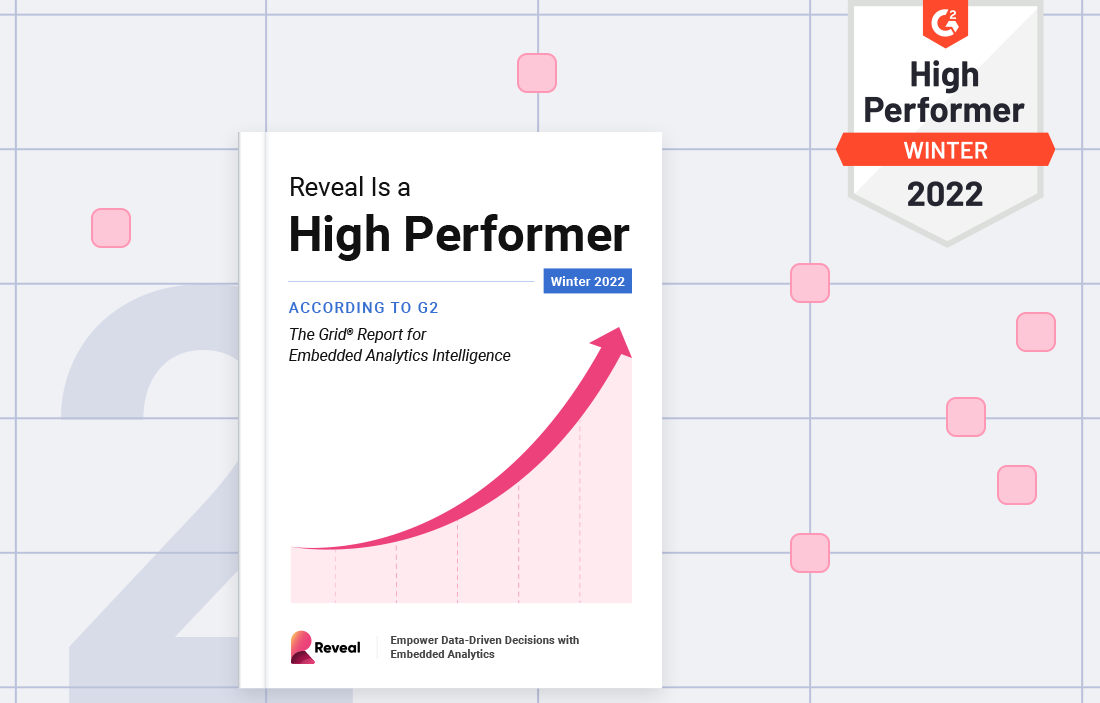
In this G2 Grid® Report, Reveal has been rated as one of the highest-performing embedded analytics solutions on the market based on great customer satisfaction ratings. Reveal scored a satisfaction rate of 4.8 out of 5.
If you’re a customer and still haven’t done that, we would really appreciate it if you took a couple of minutes to share your experience with us on our G2 page. This will help us identify any areas for improvement so we can continue delivering the best possible analytical experience to you.
In this year’s report, Reveal exceeds the industry benchmarks in key criteria such as ease of use, setup, and quality of support. Reveal’s dashboards, charts, graphs, and reporting capabilities are the highest-rated features, all exceeding industry benchmarks.
Reveal’s Highest-Rating Features
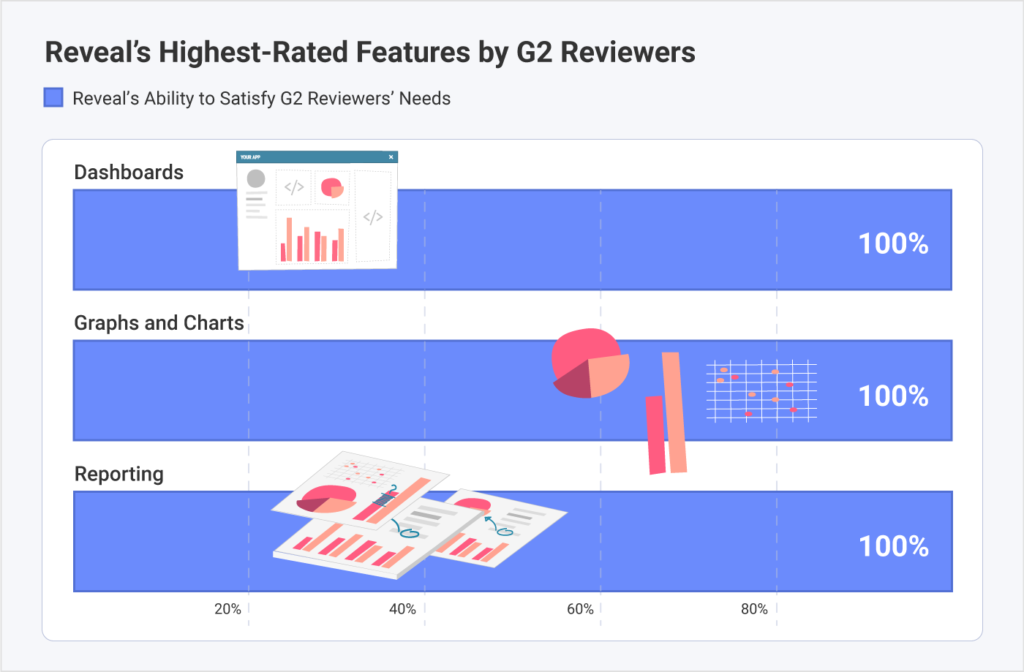
Dashboards (12% above average)
Dashboards are a major feature in data analytics and business intelligence and one of the most crucial things that you need to consider when choosing an embedded analytics vendor. Dashboards aggregate data from multiple data sources, so you can easily see and compare important insights together in one view.
Reveal is a self-service, business intelligence SDK that enables you to visualize your significant business metrics, like marketing performance, monitoring operational trends, visualizing KPIs, and optimizing customer portfolios, in one centralized location.
To provide the best user experience when it comes to embedding analytics into your existing applications, the most important thing is to have the ability to customize your dashboards so they perfectly match your app’s look and feel.
For our team, this is paramount, and that’s why we are giving our users full control over the Reveal dashboards through our SDK.
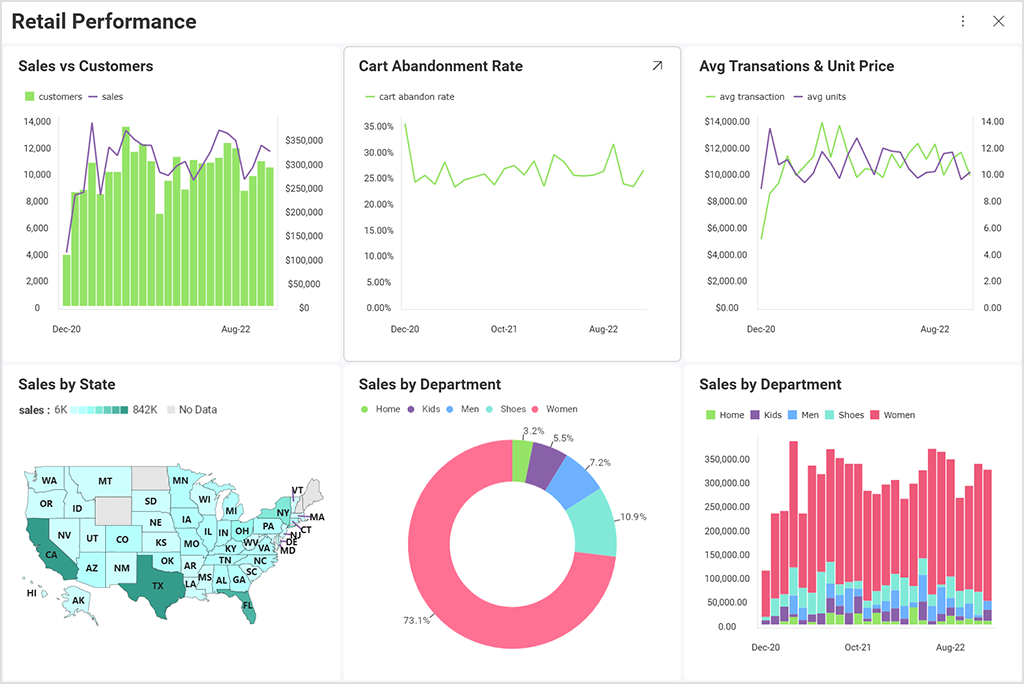
Graphs & Charts (12% above average)
A spreadsheet with hundreds of rows of numbers can seem terrifying to someone not trained in data analytics. But if that person visualizes the same information in the form of a bar chart, map, or graph, they will immediately gain insights from those numbers.
Data visualization tools can help you identify trends and patterns, understand complex information quickly and easily, communicate a story, analyze risk, address issues, and more.
Reveal offers a rich library of data visualization tools, so you can choose the best and most appropriate chart or graph to represent your data, extract actionable insights from it and make more intelligent business decisions. And because graphs and charts can’t stand alone no matter how powerful they are, we also provide advanced features such as data blending, dashboard linking, statistical functions, drill-down functionality, and more to help you gain deeper insights into your data.
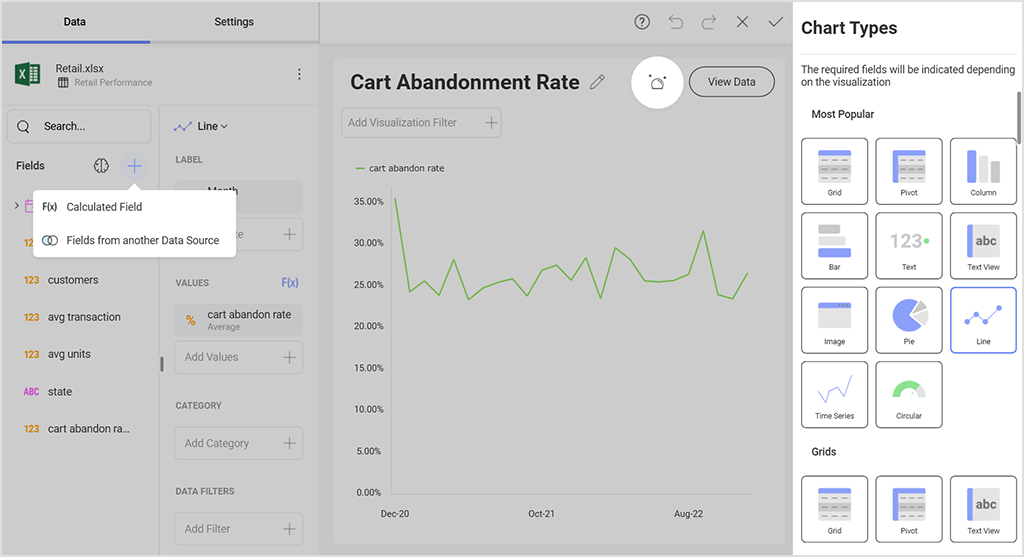
Reporting (13% above average)
Reporting capabilities should be an integral part of any embedded analytics solution. Embedded reporting tools can help you easily consolidate data from multiple large data sets and data sources and get a 360-degree view of your business and/or specific areas of it. This decreases users’ time analyzing different data sets, accelerates your time to insights, and significantly improves workflow productivity.
To clarify so that there is no confusion, reporting, and dashboards might seem the same thing, but they are not, and you should look for both robust reporting and dashboard capabilities when investing in a solution. A report is a more detailed collection of charts, graphs, tables, etc., and it is used for more detailed and comprehensive data analysis, while dashboards are used for monitoring how different aspects of the business are performing. Both, however, should always go together, as reports can provide a more detailed view of the insights presented in a dashboard.
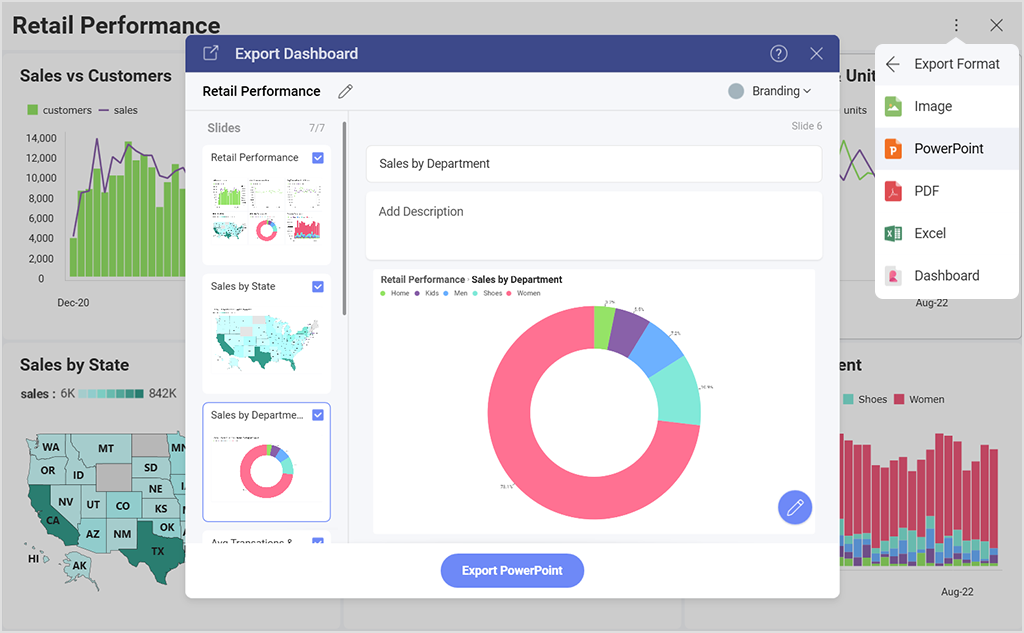
We know that all of your users are different, and each has its unique case for using analytics and a different level of sophistication when it comes to working with data. That’s why we provide our users with self-service reporting capabilities. We let users easily create informative reports and quickly export them to Excel and PowerPoint.
Self-service features are the tools and processes that empower end-users to analyze large amounts of data, build custom dashboards, and create reports independently. This is very important for us as one of our main goals is to help our customers cultivate a data-driven culture for their businesses. With self-service capabilities, even users with no data knowledge or experience can serve their data needs instead of waiting for ITs or BI experts to do it for them and act on their findings at the point of impact. It brings effortlessness and effectiveness to the decision-making process and makes the decisions better, smarter, and, most importantly, data-driven.
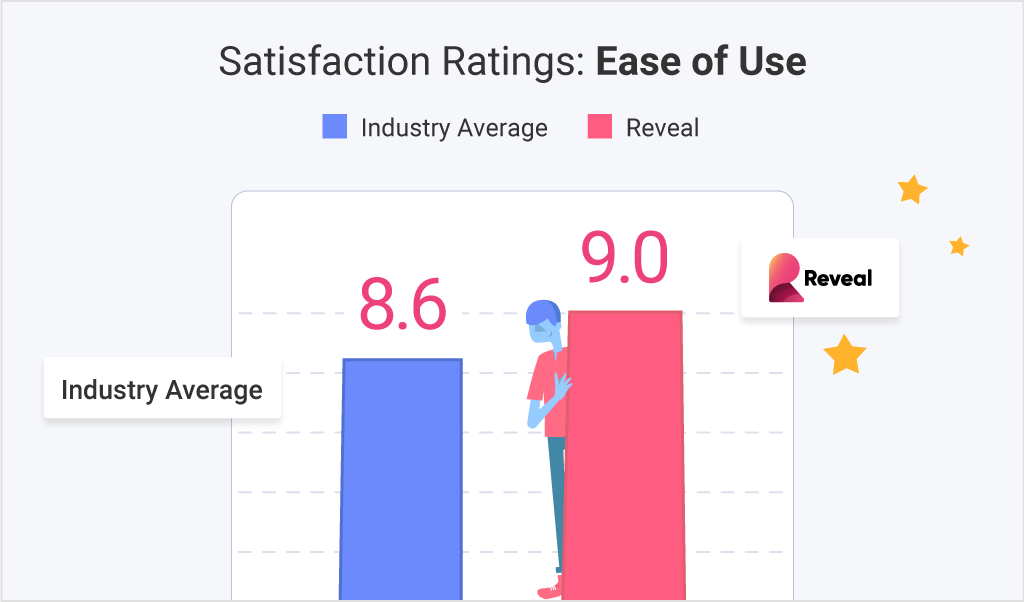
Ease of Use (9.0 compared to the industry average of 8.6)
In the ease of use segment of the satisfaction score, Reveal is one of the highest-rated solutions. Providing a superior user experience is one of our top priorities, so we are constantly working in that direction.
We believe that the benefits of embedded analytics and BI must be available to and easily accessed by anyone inside an organization, regardless of their levels of data experience and skills. That is part of the reason why we build our product as a self-service solution, so we can make data more accessible to anyone that needs it.
Part of the self-service features that we offer to ease our users’ analytical experience includes an intuitive drag-and-drop interface, seamless connectivity with various data sources, and predefined dashboard templates.
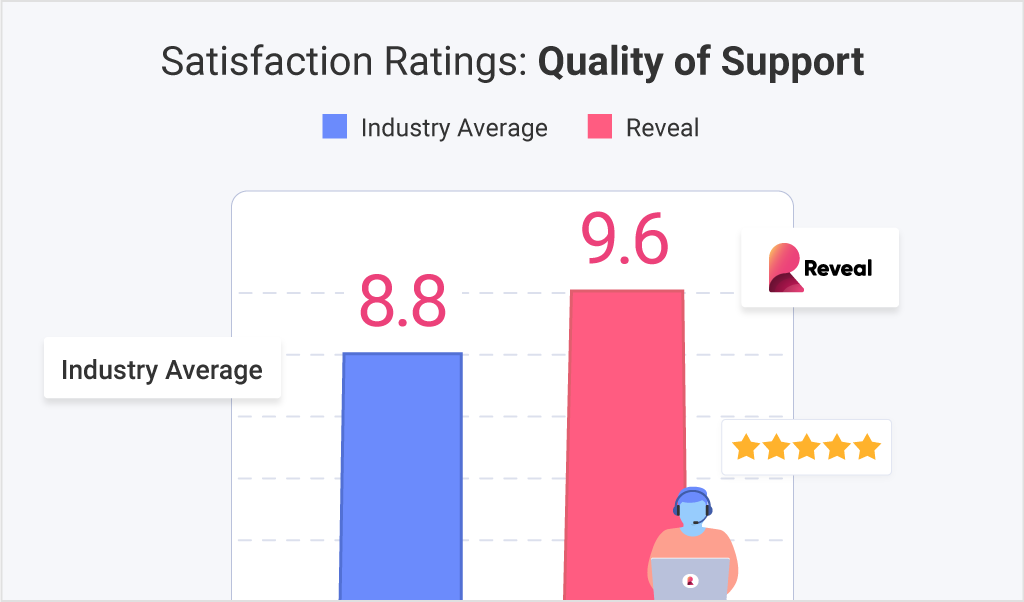
Quality of Support (9.6 compared to the industry average of 8.8)
When choosing the right embedded analytics vendor to partner with, it’s important to understand that it is not just about technology; it’s also about finding high-level, quality, and experienced support that can ensure your success.
For that reason, we are extremely happy to be rated so highly. Our community support is available to answer any questions 24/7. We also put in a lot of work to make our documentation and FAQs as helpful as possible and are very honored to find out that our customers appreciate this that much.
Ease of Setup
When it comes to integrating analytics into your existing application, it is essential that the software flows seamlessly. It shouldn’t add any additional weight and complexity. To be able to flow seamlessly, it needs to be built from the ground up with embedded in mind first, just like Reveal is. With an architecture that provides flexibility and no added requirements, with Reveal, you can quickly integrate analytics into your code, keeping up with customer demand.
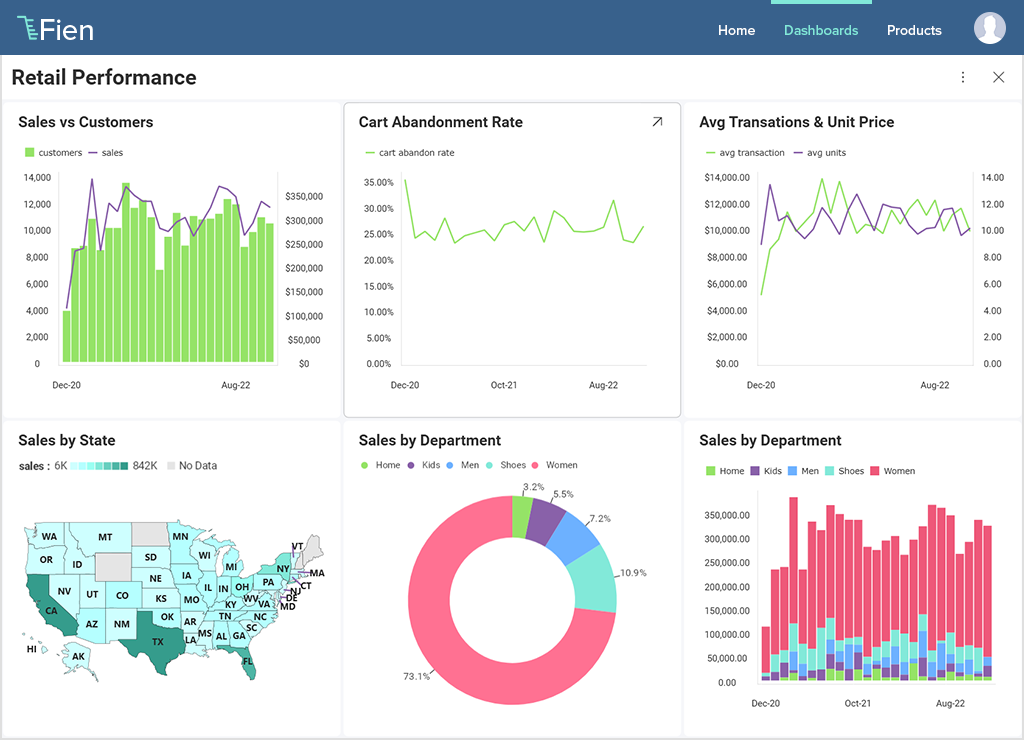
Reveal’s SDK is made for developers. With it, developers aren’t forced to simply embed iframes into your application and configure dashboards with a parameterized URL. Your developers can use real code with real objects and real properties.
Reveal’s native SDKs can be integrated into applications on any platform and tech stack, including .NET Core, Java, NodeJS, and front-end technologies such as React, Angular, WebComponent, VueJS, jQuery, MVC, and Java Frameworks like Spring, Tomcat, Apache. We support native web, desktop, iOS, and Android SDKs.
Introduction to Reveal
Reveal embedded analytics solution provides organizations with the most powerful, flexible, and predictably priced analytics tools on the market. Reveal provides developers with a wide range of highly customizable and easy-to-use embedded analytics tools and data visualizations, which end users can immediately understand. These tools make your app stickier and allow you to differentiate yourself from competitors.
Reveal offers one single and simple, and affordable price point that enables you to reach unlimited users per application. Our pricing structure is affordable and transparent, so you can predict exactly what you will be paying and therefore calculate your embedded analytics ROI better. We believe in collaborating closely with our clients to ensure that their users’ needs are met at all stages.
Our app support offers a range of ongoing support services with no additional costs, in conjunction with a friendly, 24-hour community that can answer any question on our forums. What’s more, transparency is a key value for our business, and we never collect your customers’ data.
Final Thoughts
The fact that we have been rated so highly by our customers really pleases us, but it doesn’t mean that we’re going to stop here. Our team of developers, data specialists, etc., are working on improving and delivering the best possible embedded analytics experience every single day.
There will be a lot of new things coming in 2022, and if you’re interested in learning more about what to expect, you can check out our public product road map.
For more insights from our customers, you can also read how the cybersecurity innovator Sensato accelerates its time-to-market x10 with Reveal or how Casebook, an industry-leading case management SaaS platform for the human services field, integrates real-time reporting, interactive data visualizations, and advanced analytics to its software. “Reveal makes it simple for caseworkers to run a report and see it in a beautiful chart or visualization that meets their reporting demands’’ – says Ninad Amondikar, Data Product Manager at Casebook.
We know that you probably have a lot more questions about Reveal and whether it is a good fit for your unique business case, and we’re always happy to answer them and help further. Get in touch with Casey McGuigan at CaseyM@revealbi.io.
Learn more about Reveal, the complete embedded analytics solution:
Book a demo – See Reveal in action and learn how it can accelerate your business.
Talk to an expert – Book a call with our sales team and get answers to all your questions.


