Stay up to date with Reveal
Reveal business intelligence blog gives you the latest embedded analytics trends, how-tos, best practices, and product news.

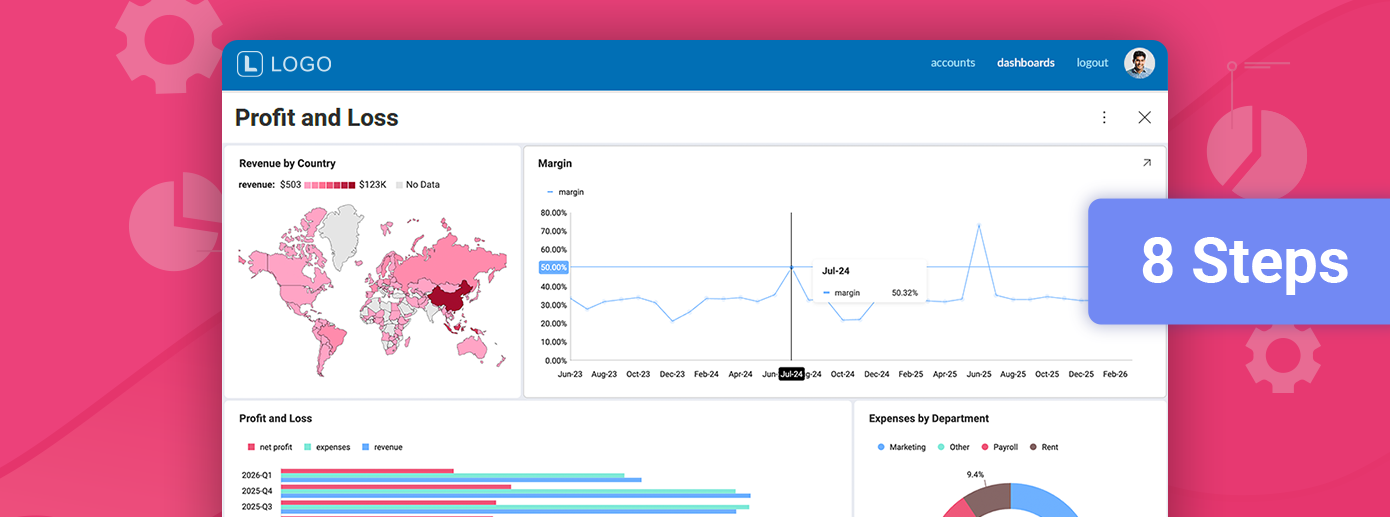
8 Steps to Embedded Analytics in FinTech Success
FinTech products compete on trust, compliance, and speed. Customers expect insights inside the product, not in external BI portals. That’s where embedded analytics in FinTech becomes critical. By embedding secure, branded dashboards directly into applications, SaaS teams meet regulatory demands, scale across tenants, and build adoption without slowing product roadmaps.
Continue reading...TEST TABLE STYLE EXPANDED
To help you make an informed choice, we analyzed and compared the 12 best embedded analytics platforms side by side, focusing on the features that matter most for ISVs and SaaS companies. Features compared: Platform Embedding Method White Label Capabilities Self-Service Dashboards Pricing Model Deployment Flexibility Data Source Compatibility AI Features Reveal SDK Full Yes […]
Continue reading...
5 Best White Label Analytics Platforms of 2025
We compared five leading white label analytics platforms across branding, integration, performance, scalability, data connectivity, user capabilities, and advanced features. Each platform offers a different balance of customization, speed, deployment flexibility, and pricing. This guide helps SaaS companies and ISVs identify which solution best fits their product requirements, customer expectations, and long-term growth plans.
Continue reading...
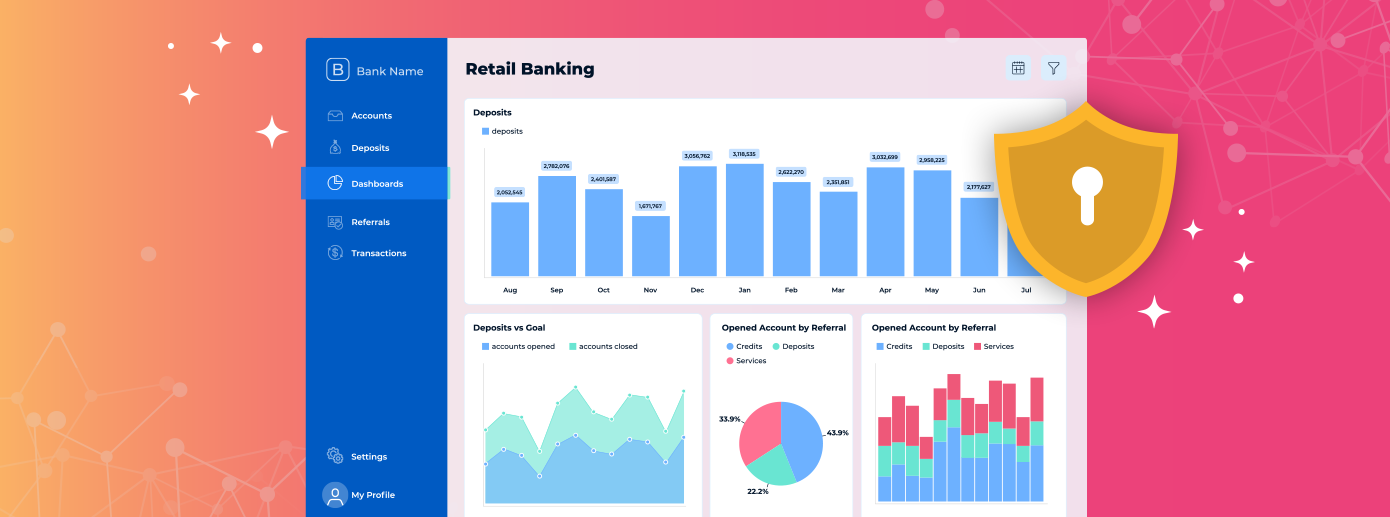
Ensuring Security with Embedding AI-Powered Analytics
Security with embedded analytics gets more complex when AI enters the picture. This article breaks down the key risks, offers best practices to prevent data leaks, and explains how Reveal gives SaaS teams full control over AI endpoints, data flow, and governance. If you’re embedding AI-powered analytics into your product, Reveal helps you do it securely by design.
Continue reading...
Boost Customer Retention with Embedded Analytics in 2025
Churn happens when users lose sight of value. Customer retention with embedded analytics means showing outcomes where they matter—inside your product. This guide breaks down how SaaS teams use real-time dashboards, role-based insights, and self-service tools to keep users engaged and reduce churn. See how platforms like Reveal make retention scalable, measurable, and built into the experience.
Continue reading...MAGIC-TEST NARROW COLUMNS
Download: This is just a placeholder text. Create calm and efficiency across teams, departments, and external clients by making it easier to find and access information. Tools Key Features Pros Cons Reveal Code gen for Angular, React, Web Components, Blazor, Figma-to-code, App Builder AI, GitHub integration, 65+ UI components, DesignOps & DevOps, No vendor lock-in […]
Continue reading...
Scalable Analytics: How to Build for Growth Without Breaking BI
For SaaS companies, user growth should accelerate success, not burden your analytics infrastructure. Yet for many SaaS leaders, BI costs surge faster than customer acquisition, and legacy systems struggle to cope with growing data volumes and concurrent user demands. The result? Your analytics can’t keep pace with product momentum, turning scalable analytics into a distant […]
Continue reading...Magic TEST
To help you make an informed choice, we analyzed and compared the 12 best embedded analytics platforms side by side, focusing on the features that matter most for ISVs and SaaS companies.
Continue reading...
The Missing Piece in Enterprise BI: Intuitive, Embedded, and Self-Service Analytics
Most enterprise BI platforms were built for internal reporting, not for modern SaaS products utilizing customer-facing analytics. They sit outside your application, fragment your UX, and delay decision-making. Modern enterprise software requires analytics that are intuitive, embedded, and self-service by design. Reveal was built to deliver exactly that—with no iFrames, no handoffs, and no compromises.
Continue reading...
What is Self-Service BI: Benefits, Use Tools, Considerations
Self-service BI empowers users to explore and act on data without relying on technical teams or submitting support tickets. It gives business users the tools they need to generate insights, build reports, and make decisions in real time, on their own.
For SaaS products and internal platforms, embedding self-service BI directly into your application extends that value by delivering a seamless and native analytics experience that is fast, scalable, and fully customizable.
Continue reading...

