
Stay up to date with Reveal
Reveal business intelligence blog gives you the latest embedded analytics trends, how-tos, best practices, and product news.
Top 12 Best Embedded Analytics Platforms
Choosing the wrong embedded analytics platform slows your roadmap, increases dev burden, and weakens the product experience. Many tools check feature boxes but fail on pricing models, embedding control, integration fit, and long-term scale.
Continue reading...
Sisense Embedded Analytics Alternative
Embedded analytics has become a critical requirement for modern SaaS products. Whether you’re building an application from the ground up or adding dashboards into an existing application, the ability to seamlessly integrate analytics into your UX—without compromising speed, scale, or flexibility—can significantly impact user experience and development velocity.
Continue reading...Reveal 1.7.4 Now Connects to Databricks—Here’s Why It Matters
You asked and Reveal delivered! By popular demand Reveal 1.7.4 is officially live and now includes native support for Databricks. Why is this a game-changer?
Continue reading...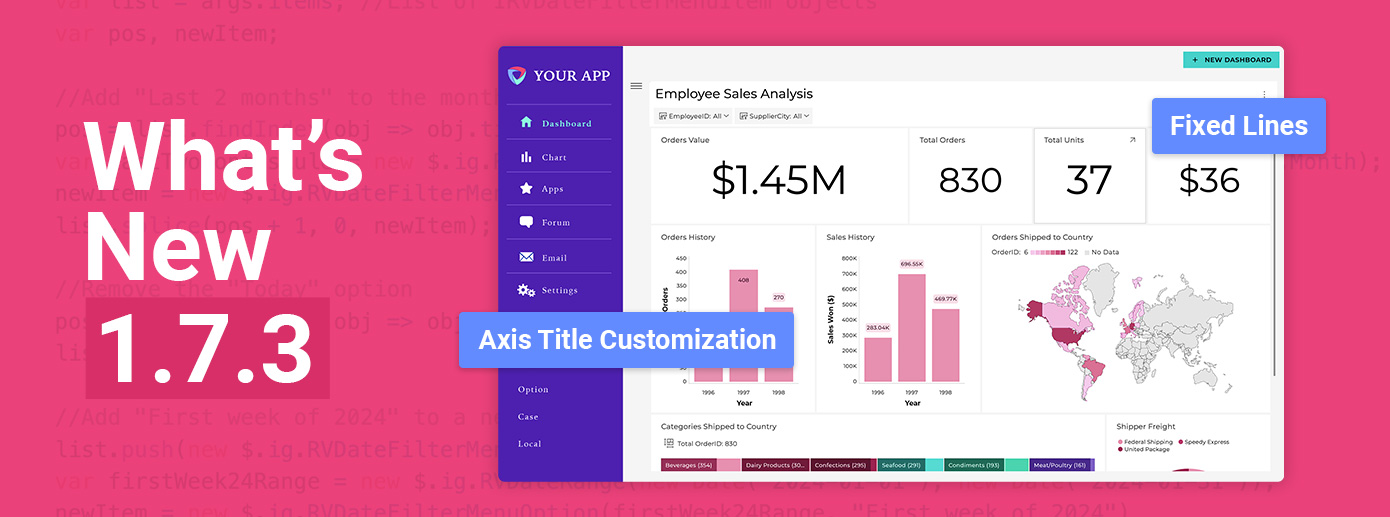
Reveal 1.7.3 is Here: Smarter Analytics, More Control, Better User Experience
Reveal Version 1.7.3 is live, bringing powerful new enhancements that put more control in the hands of developers and product teams.
Continue reading...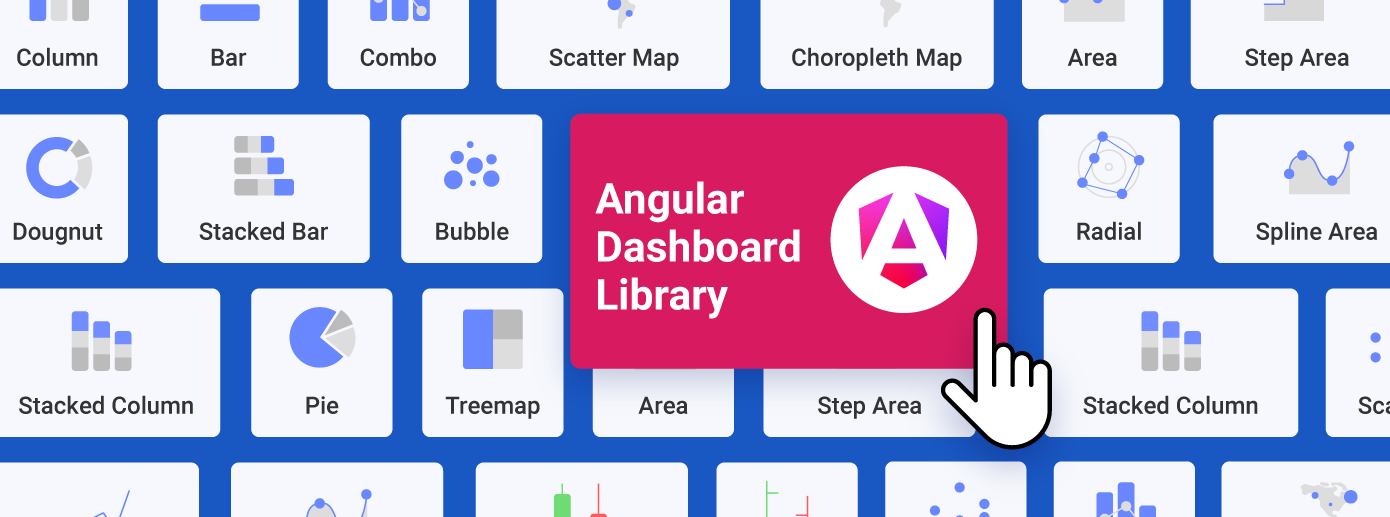
Choosing the Right Angular Dashboard Library for Your Next Project
When starting a new project, deciding which Angular dashboard library to use is crucial for the project’s success. A well-chosen library can streamline your development process and enhance your application’s analytics capabilities.
Continue reading...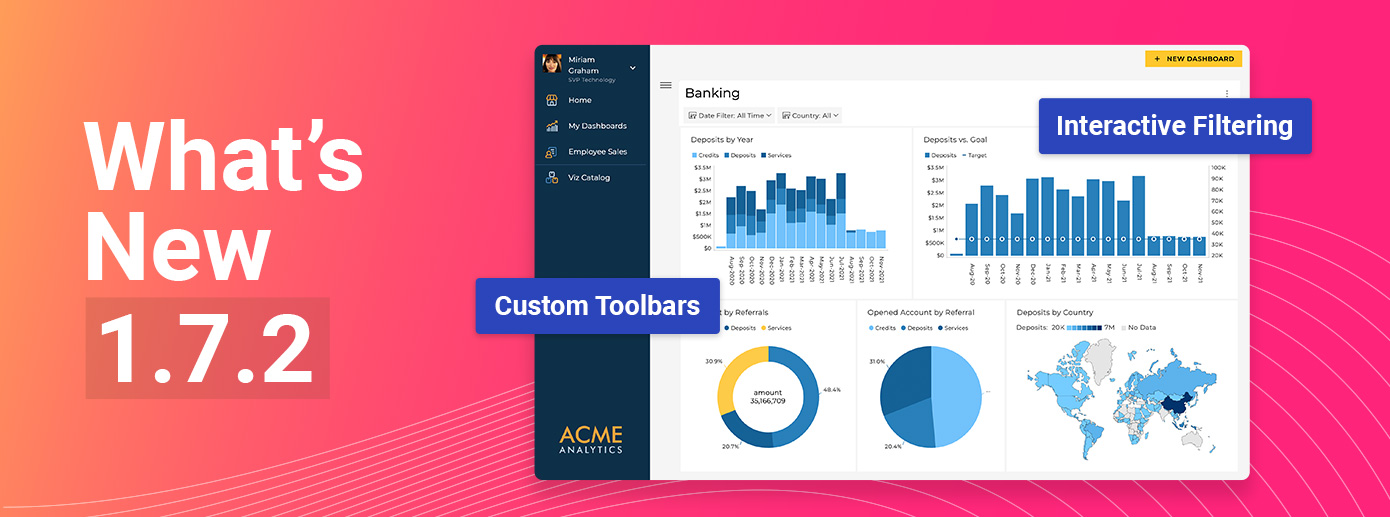
Reveal’s Latest Update: Empowering Developers with Unmatched Customization
Reveal Version 1.7.2 is Live!
What This Means for You: Gain full control with powerful customization tools and seamless data interaction to build tailored, intuitive analytics experiences.

How to Integrate Embedded Analytics in Angular Apps with .NET Core
Find out how to integrate embedded analytics into Angular applications with a .NET Core backend, for better decision-making capabilities that drive engagement and ROI.
Continue reading...
The Ultimate Guide to Embedded Analytics Requirements for 2025
In this guide, we’ll cover the key 2025 requirements for selecting an embedded analytics platform, how it benefits product analytics, and the current available implementation methods.
Continue reading...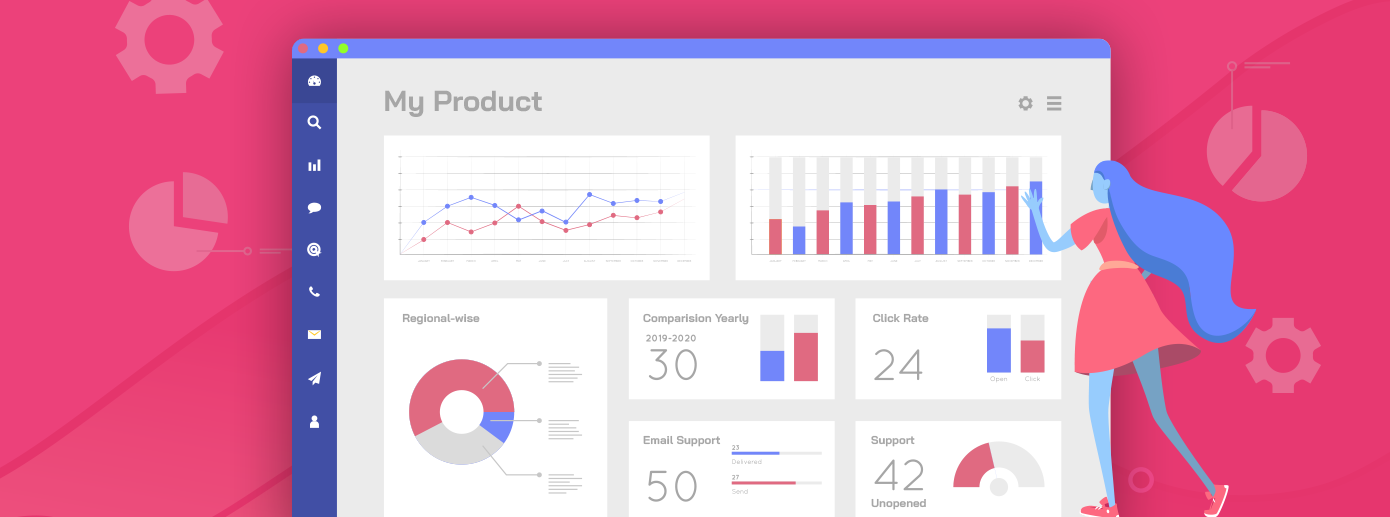
Product Analytics: Guide for Product Owners in 2025
By embedding product analytics into your product strategy, you’ll have the data you need to not only optimize performance, but also ensure long-term success. Find out more in our guide below.
Continue reading...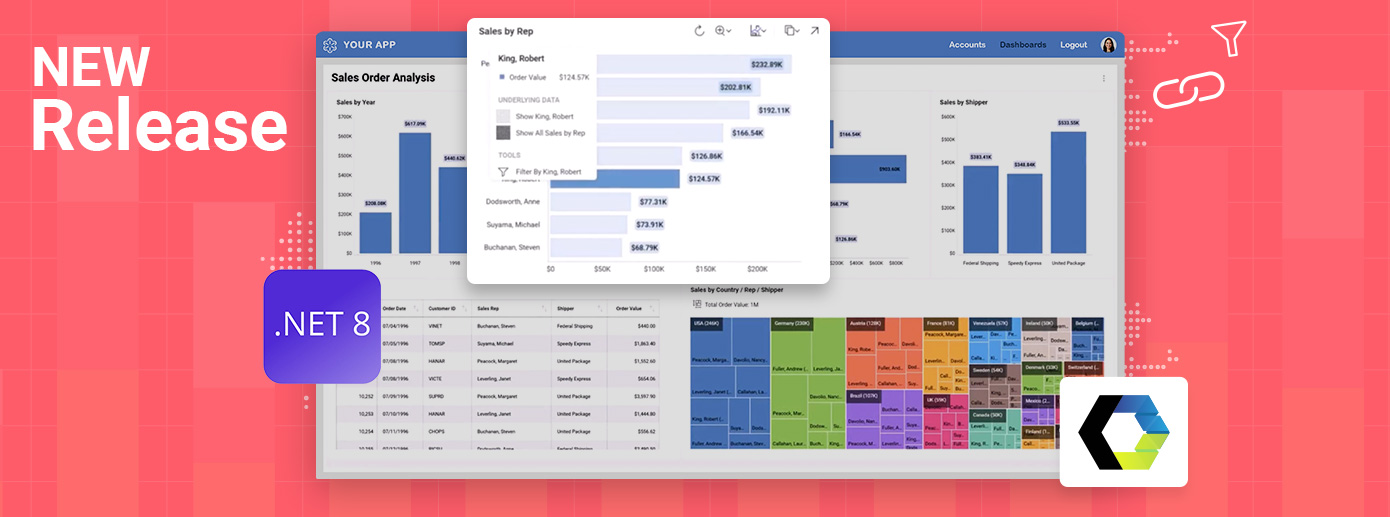
.NET 8, Customizable Tooltips, & More: Enhance Your Dev Experience with Reveal
Reveal is excited to launch new features and updates designed to enhance your development experience and deliver more flexibility and control for embedding analytics.
Continue reading...

