
Stay up to date with Reveal
Reveal business intelligence blog gives you the latest embedded analytics trends, how-tos, best practices, and product news.
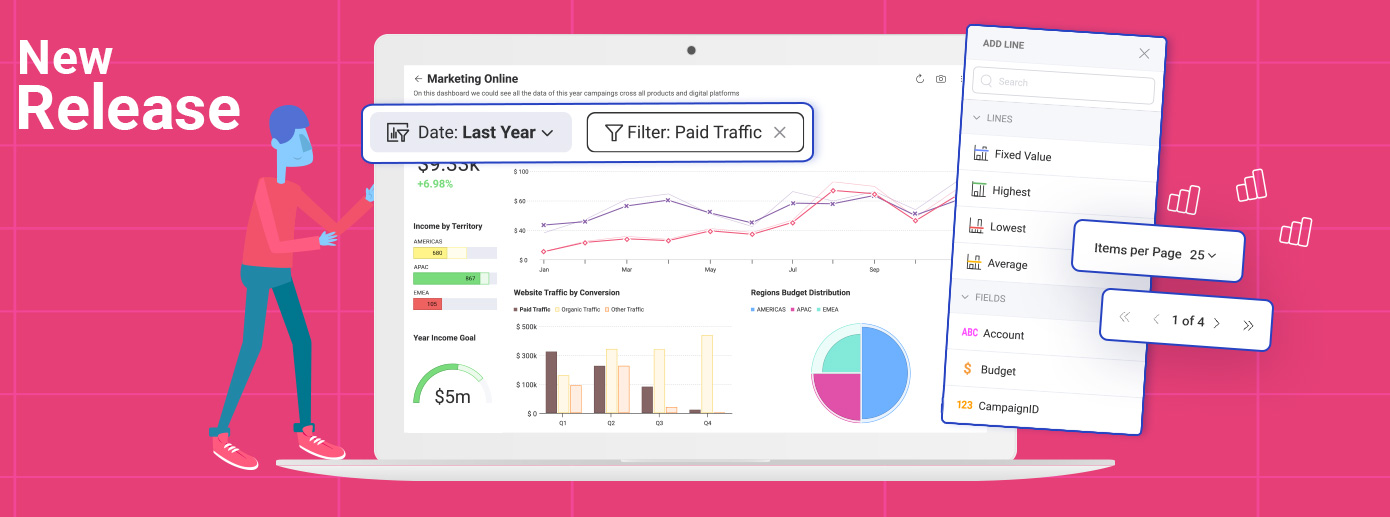
Reveal 1.7.0: Server-Side Paging, Fixed Lines, and More
We’re excited to announce the latest Reveal release, packed with powerful new features designed to enhance your analytics capabilities while keeping you informed of critical breaking changes that may impact your applications.
Continue reading...
5 Ways To Overcome Integration Challenges in Embedded Analytics
Embedded analytics has become a vital component of modern applications, providing users with real-time insights that drive smarter decisions. However, integrating these analytics seamlessly into your existing systems is often easier said than done.
Continue reading...
Conversational Analytics in Embedded Analytics
Conversational analytics gives users a faster way to get insights by letting them ask direct questions instead of building reports. It reduces friction across the product and helps teams deliver clear answers without extra clicks or technical steps. The challenge appears when conversational analytics software relies on external AI services, which creates security and data-control risks. Reveal solves this with an architecture that keeps AI inside your environment and applies your existing rules to every request. You get a secure, flexible layer that supports natural-language queries without exposing your data.
Continue reading...Why Is Flexibility in Embedded Analytics a Non-Negotiable?
In this article, we’ll explore the implications of limited customization in embedded analytics and why it’s a critical issue for CTOs, product managers, and development teams.
Continue reading...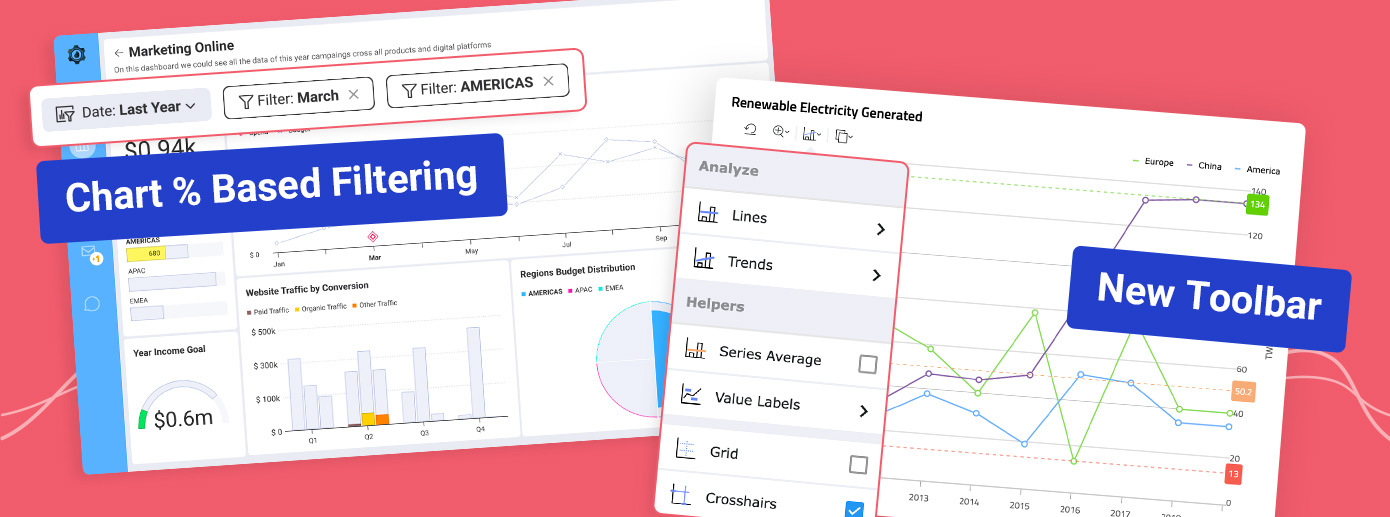
Reveal 1.6.7 Is Here! Chart % Based Filtering, Enhanced Security for SQL Data Sources, and More…
We are thrilled to announce the release of Reveal 1.6.7. This release introduces a series of new powerful analytics features and enhancements designed to offer superior customization, deeper integration, and more robust analytics capabilities.
Continue reading...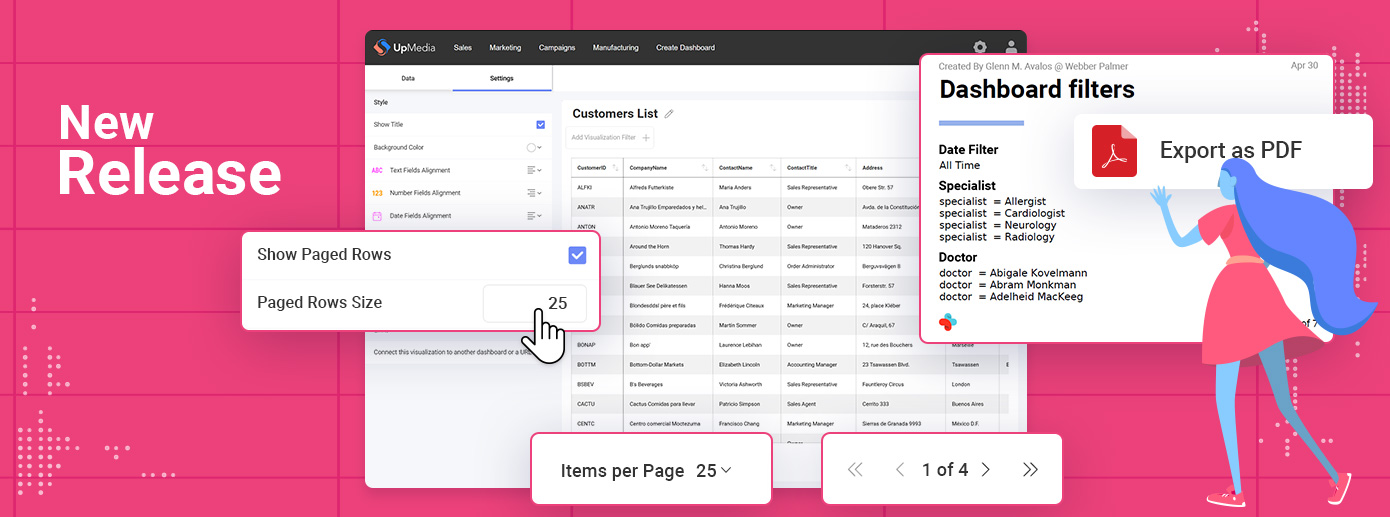
Reveal 1.6.6: What’s New in Embedded Analytics
Learn about the latest features and enhancements in Reveal – the powerful and easy-to-use embedded analytics platform.
Continue reading...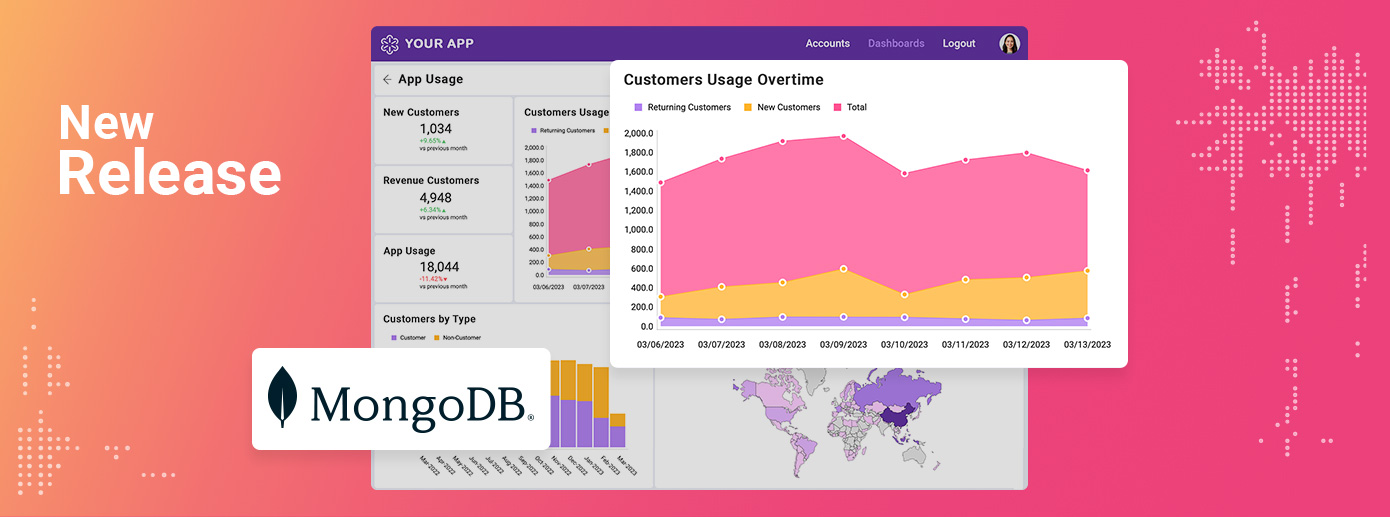
MongoDB Support and More in Reveal 1.6.1. Release
The latest Reveal release, 1.6.1, is here, packed with improvements based on your feedback.
Continue reading...How Can Embedded Analytics Increase Customer Satisfaction
We present you six powerful ways in which embedded analytics tools can increase customer satisfaction:
Continue reading...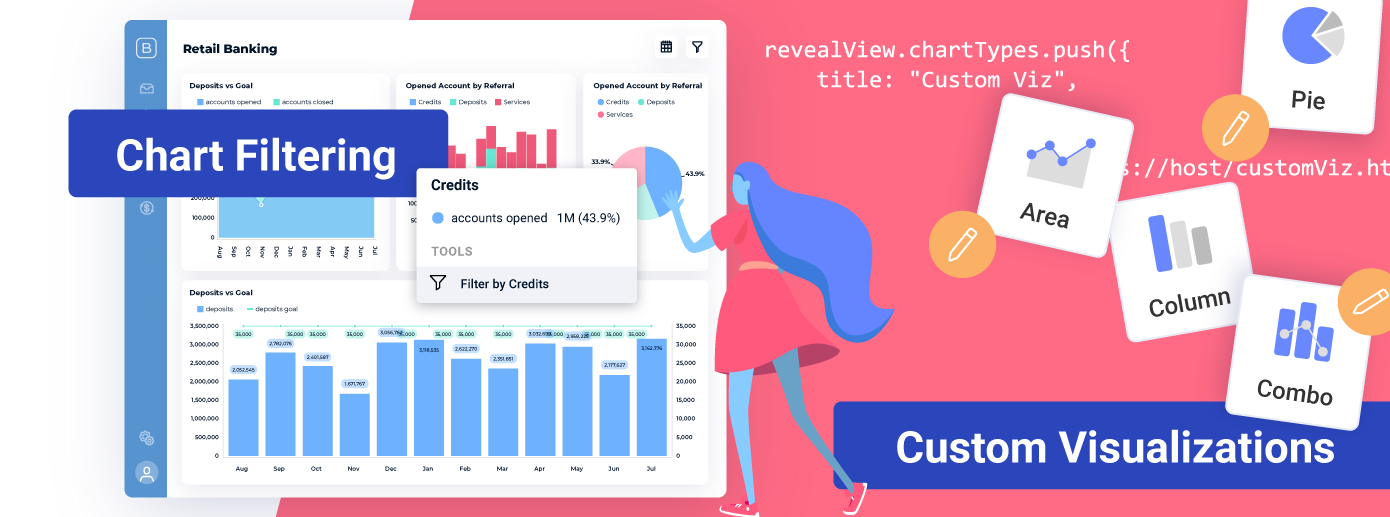
Reveal 1.6.0 Features Are Here!!
Introducing custom visualizations, interactive chart filtering and a host of other enhancements and bug fixes that help us provide you with the best embedded analytics solution you deserve.
Continue reading...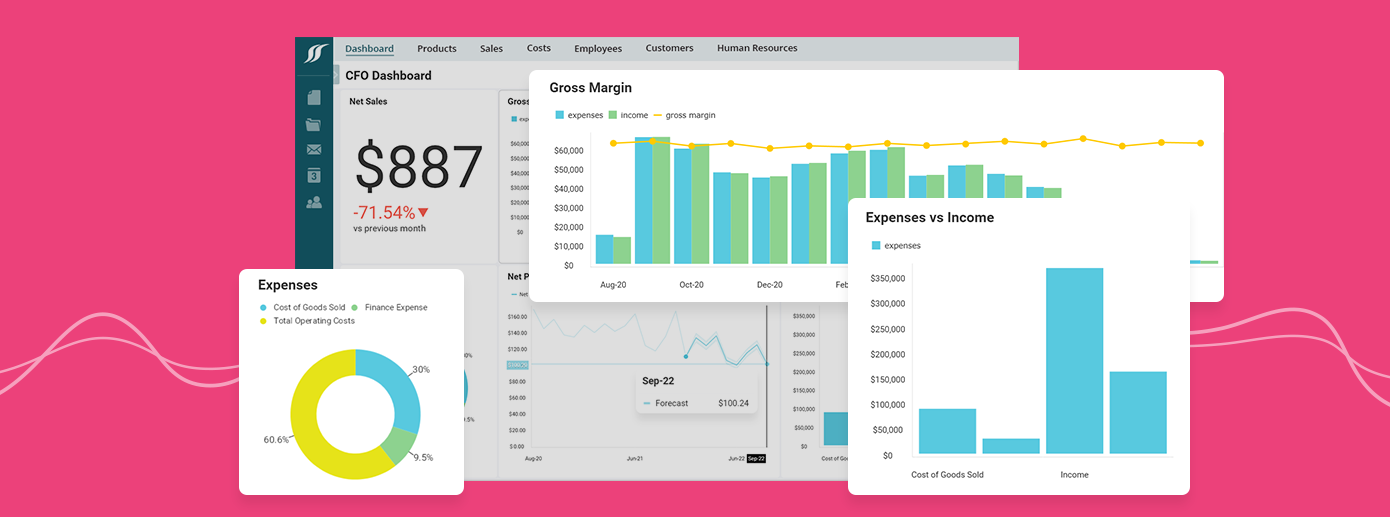
Dashboard Linking in Embedded Analytics: Definition, Benefits & Use Cases
Learn how dashboard linking can provide seamless navigation between interconnected dashboards and enhance your data exploration.
Continue reading...

