
Author
Casey Ciniello
Casey has a BA in mathematics and an MBA, bringing a data analytics and business perspective to Infragistics. Casey is the Product Manager for the Reveal Embedded analytics product and was instrumental in product development, market analysis and the product's go-to-market strategy. She’s been at Infragistics since 2013 and when she’s not in the office, she enjoys playing soccer and attending concerts. Test link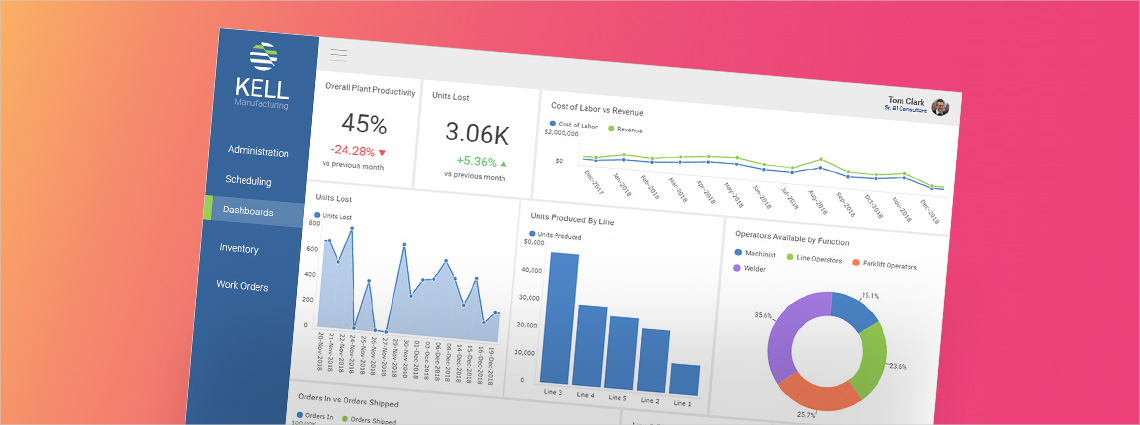
Why is ERP the Most Popular Embedded Analytics Application?
It’s important that analytics and visualizations are embedded within the ERP software itselfitself, so users don’t have to export the data to a separate application. And if the analytics are easy for business users to use with self-service capabilities, then more people throughout a company can do deeper dives into a range of pertinent business data.
Continue reading...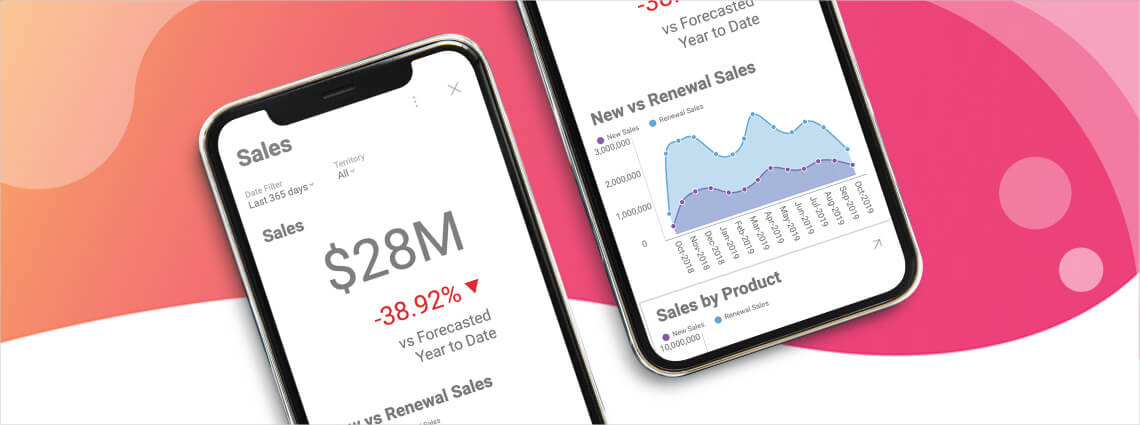
What is Mobile BI & Why is it Important?
Having company insights at your fingertips is the most valuable advantage of mobile BI. You are not limited to one computer in one location, but instead, you can access important data information on your mobile device at any time and from any location.
Continue reading...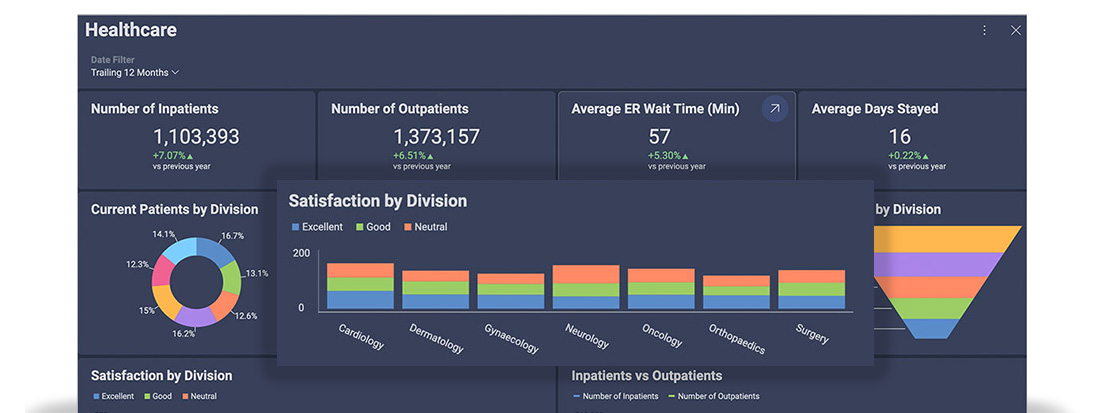
5 Steps to App Modernization
Legacy apps limit product velocity and insight delivery. Embedded analytics in app modernization helps SaaS teams replace slow workflows with in-product decisions. This guide breaks down five practical steps to modernize architecture, improve user experience, and monetize analytics as a product feature. Reveal gives your team the SDKs, security, and white label control to embed fast, scale cleanly, and reduce backlog.
Continue reading...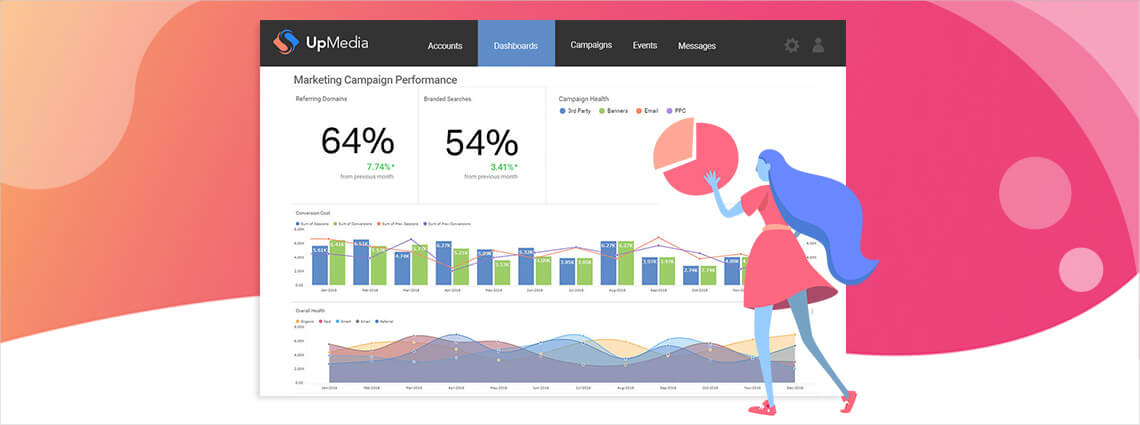
Why You Need Data Driven Decision Making
Data-driven insights can help you identify business opportunities, detect customer journey leaks, and proactively identify weaknesses in your product before they grow into serious problems.
Continue reading...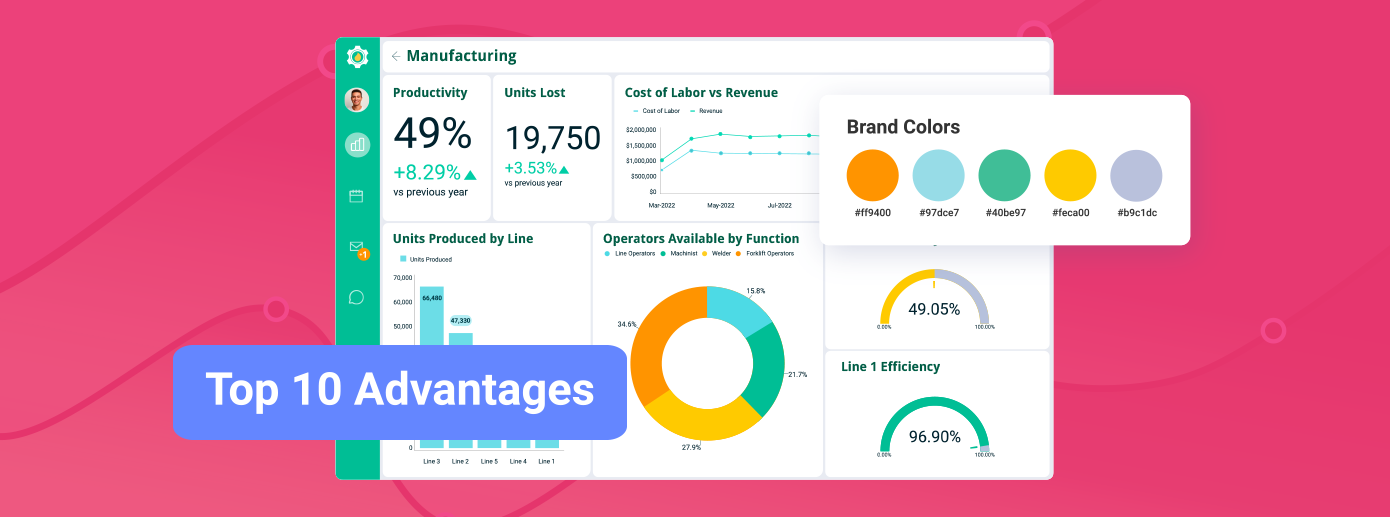
Benefits of Embedded Analytics: The Top 10 Advantages for Your Business
The real value of embedded analytics is how it strengthens products and business outcomes. It shortens development cycles, cuts costs, and keeps analytics inside the workflow where users need it. The biggest payoffs are higher adoption, predictable ROI, and new revenue through monetization. With SDK-first integration, white-label control, and AI-powered insights, embedded analytics delivers scale, flexibility, and a lasting competitive advantage.
Continue reading...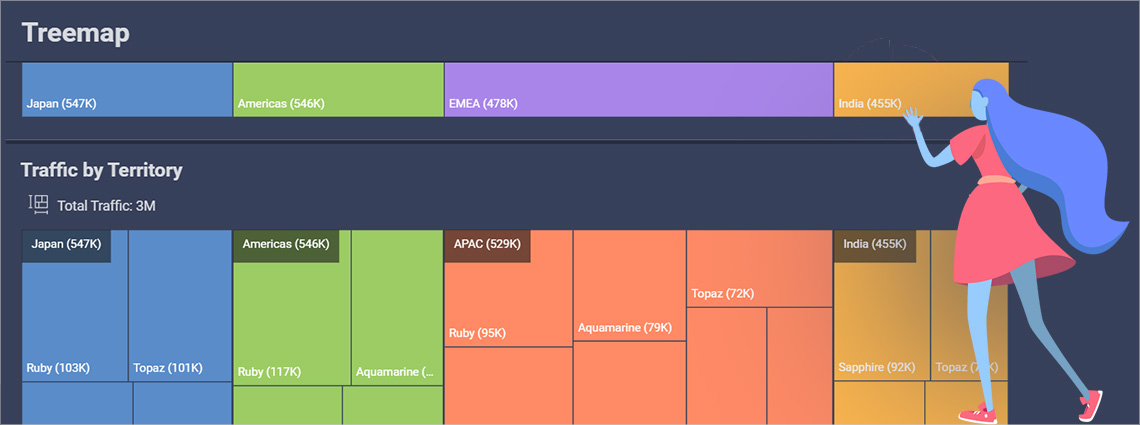
How to Create a Treemap Chart Visualization in Reveal
A Treemap Chart is designed for drill-down scenarios. It shows the relative weight of data points at more than one level allowing users to continuously drill down deeper into the data set that is represented by smaller rectangles for more efficient analysis.
Continue reading...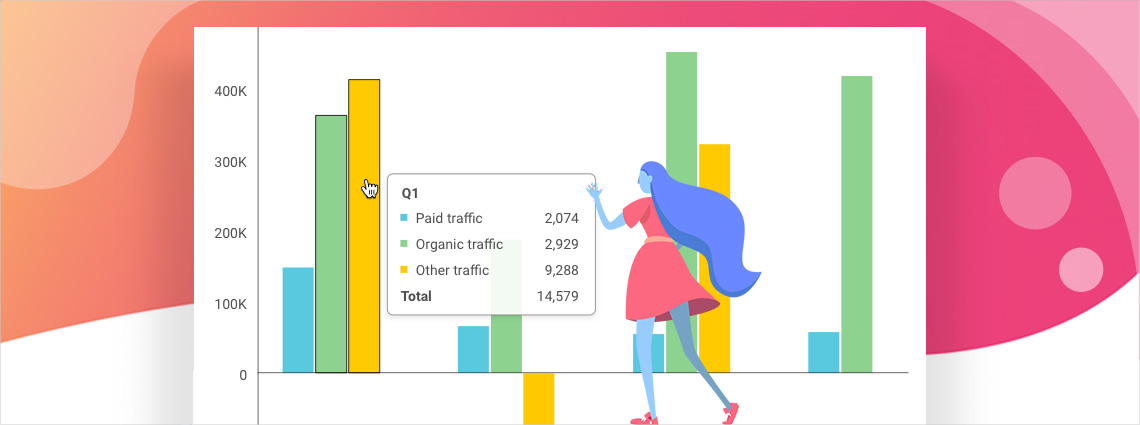
Reveal SDK Updates for Embedded Analytics
We are excited to announce a few new updates to the Reveal embedded analytics SDK in order to provide more customization. Showing Tooltips We have added a new event that will give you more flexibility with how you show Tooltips in your visualizations. The event is called revealView.TooltipShowing in WPF and .onTooltipShowing in Web and is triggered whenever the end-user […]
Continue reading...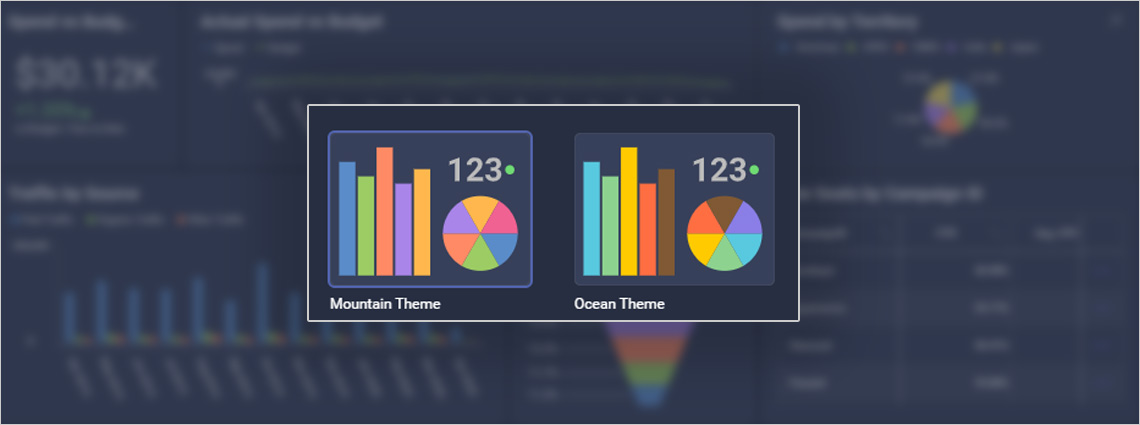
Your Dashboards — Your Look! Meet the New Custom Theming in Reveal
Reveal is all about providing you with ready-to-integrate data visualizations with embedded analytics. An important part is making sure that the elements you are embedding into your applications match the look and feel. For our application users, Reveal now has two themes provided out of the box—Mountain and Ocean—that look beautiful in both light and […]
Continue reading...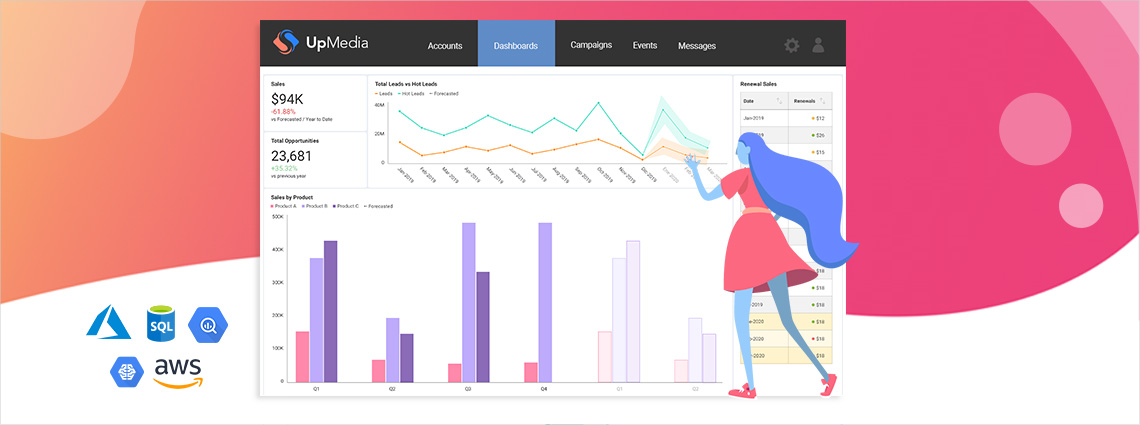
Reveal Adds Major New Features—Predictive Analytics, Big Data and More
We are thrilled today to announce another big update for our Reveal product! This release is packed with features that touch on today’s hottest topics and trends: Predictive and Advanced Analytics Machine Learning R & Python Scripting Big Data Connectors Advanced Visualization Interactions and much more I’ll highlight each feature in this blog, and with the screen shots you’ll […]
Continue reading...Creating a Population Pyramid Chart Using Stacked Bar Charts
In this blog, I’m going to show you how to create a population pyramid chart that provides an attractive at-a-glance view of the demographics of a country, typically broken down by male/female, though it can be used for other demographics as well. Here’s what the final chart will look like: Before diving into how you can create a population pyramid chart, let’s first review some of the basic chart types. What […]
Continue reading...

